
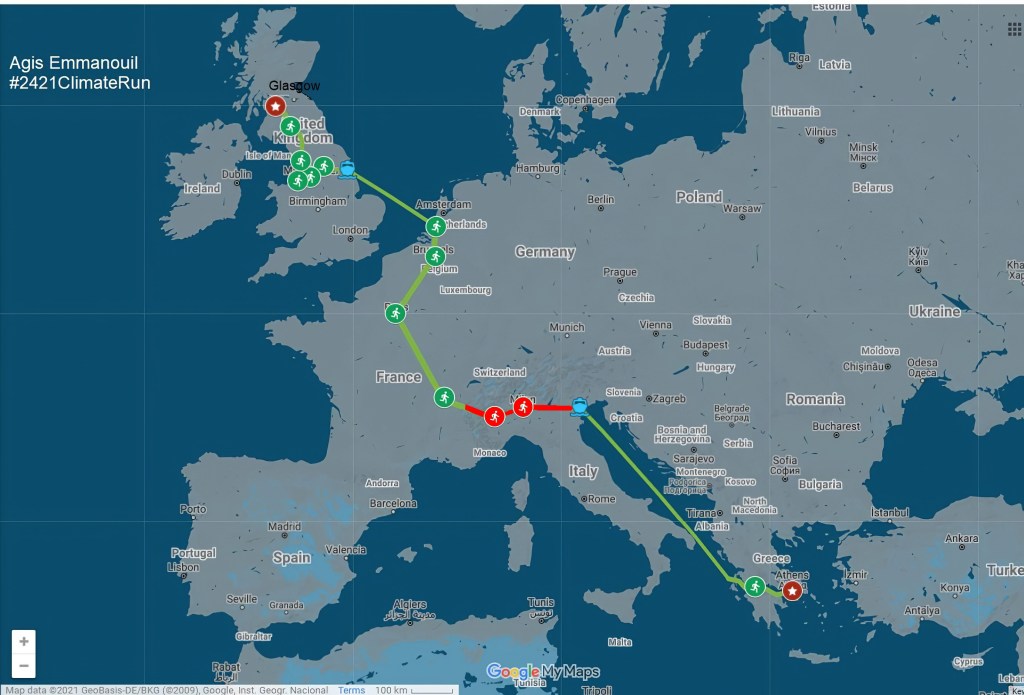
After a break of a couple of days needed for the transfer from Greece to Italy, Agis Emmanouil’s second part of the 2421ClimateRun started in Venice on August 19th. He ran all the way through the wide Padana Plain from Venezia to Torino, from where he then began going uphill towards Bardonecchia, the last village he passed through in Italy. Then, from there he crossed the Alps into France.
- Read Part 1 about the Air Quality that Agis found in Greece at the beginning of the 2421KM Climate Run.
- Read also the summary with the Air Quality insights of the whole 2421KM Climate Run, which encompasses all countries, here.

The Italian part of the run was planned to last a bit more than two weeks, but unfortunately Agis went through difficult moments due to muscle injuries at both legs, and in the end he had to spend two weeks longer in the country in order to undergo physiotherapy and give himself some recovering time.
Altogether, Agis ran the 566,6KM long Italian part of the Athens-Glasgow 2421KM Climate Run in 13 days, for a total of 89 hours and 31 minutes. Scroll down to the very end of the post to see the summary statistics of the Air Quality that Agis met in Italy.
1. Day 9, 19/08/21: Venezia-Padova, 43,5km, 5:39 hours
Agis’ run during the first day on Italian soil confirmed what we were expecting to find in term of Air Quality: high Air Pollution. The Padania Plain is among the most polluted areas of Europe, and Agis’ AQ Monitor immediately picked up the rather unhealthy air. But on this day there was also a good surprise…
Maps and Graphs of Day 9 (1st running day in Italy):
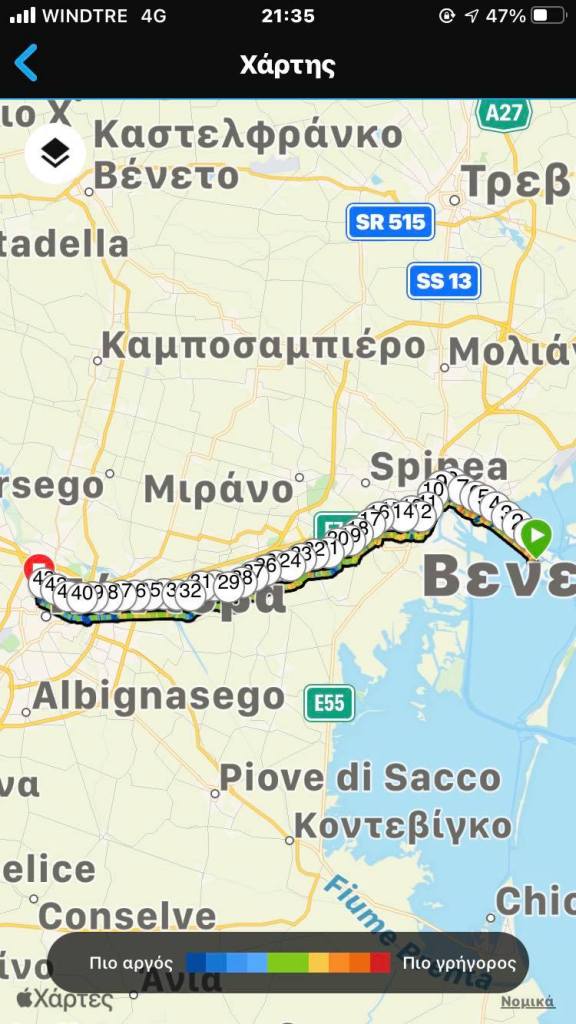
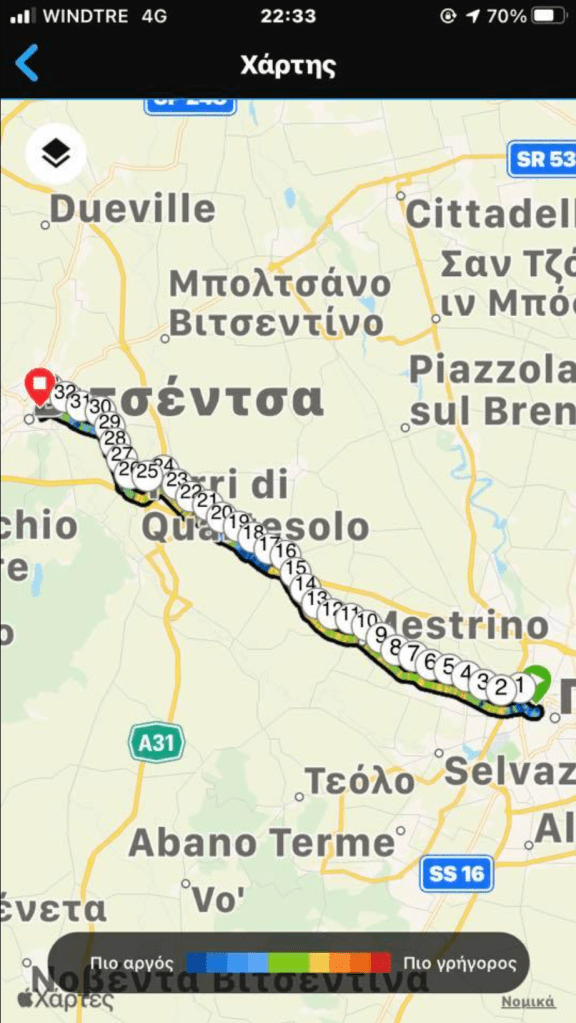
Here is the map with Agis’ course and running stats for Day 9, Venezia-Padova:

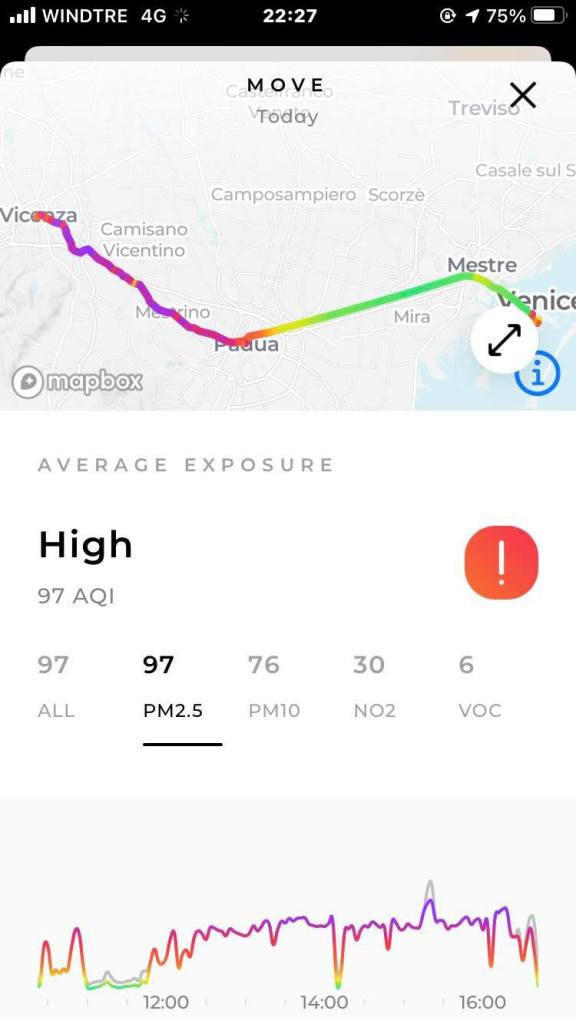
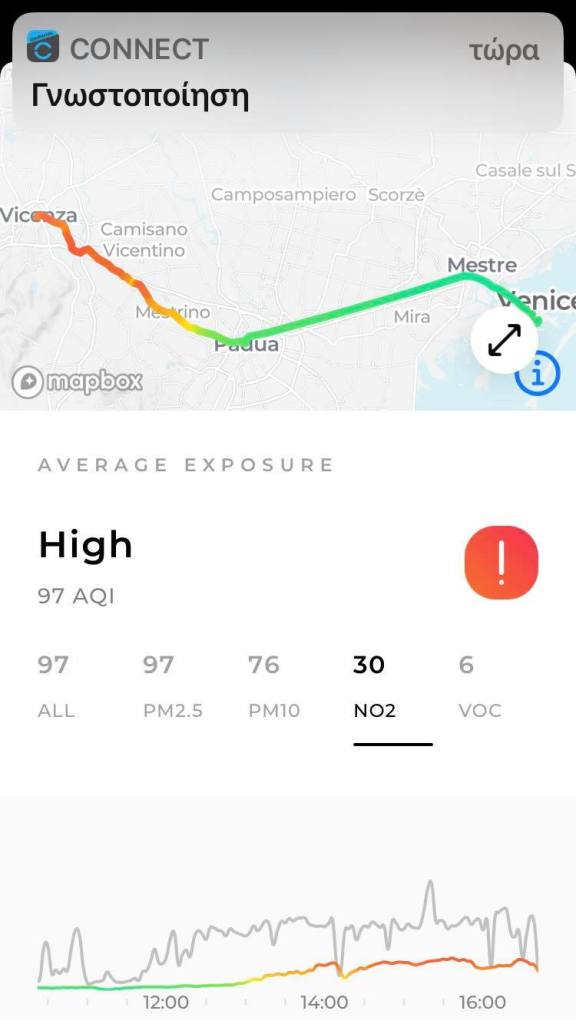
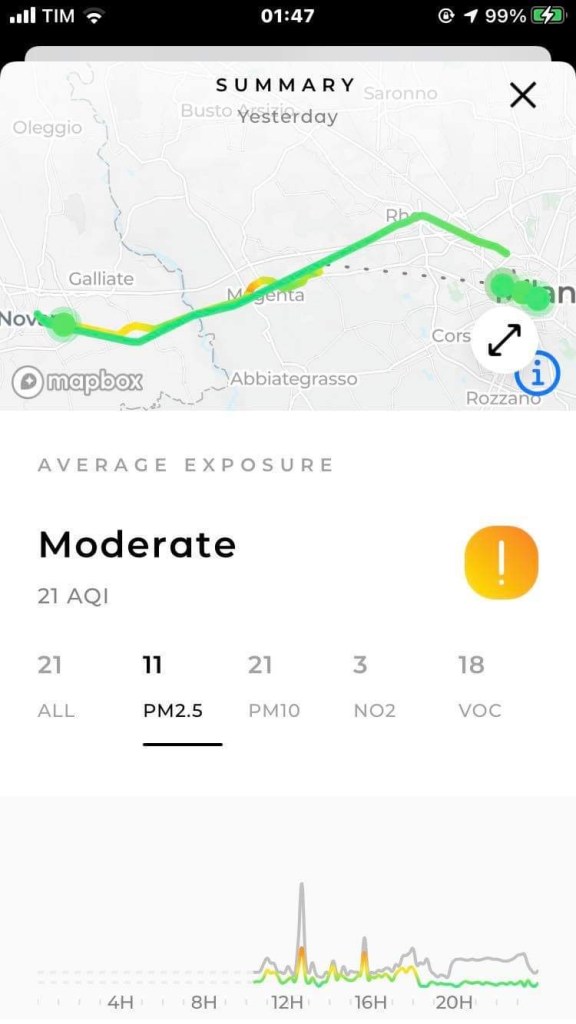
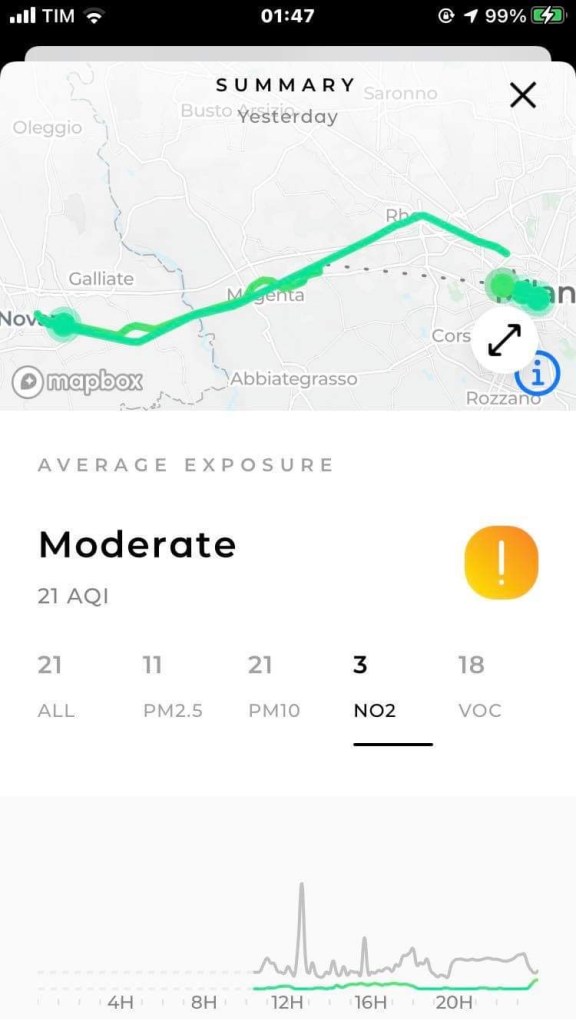
And here are the screenshots of the Air Quality (AQ) data of the Flow AQ Monitor for PM2,5 (left) and NO2 (right):
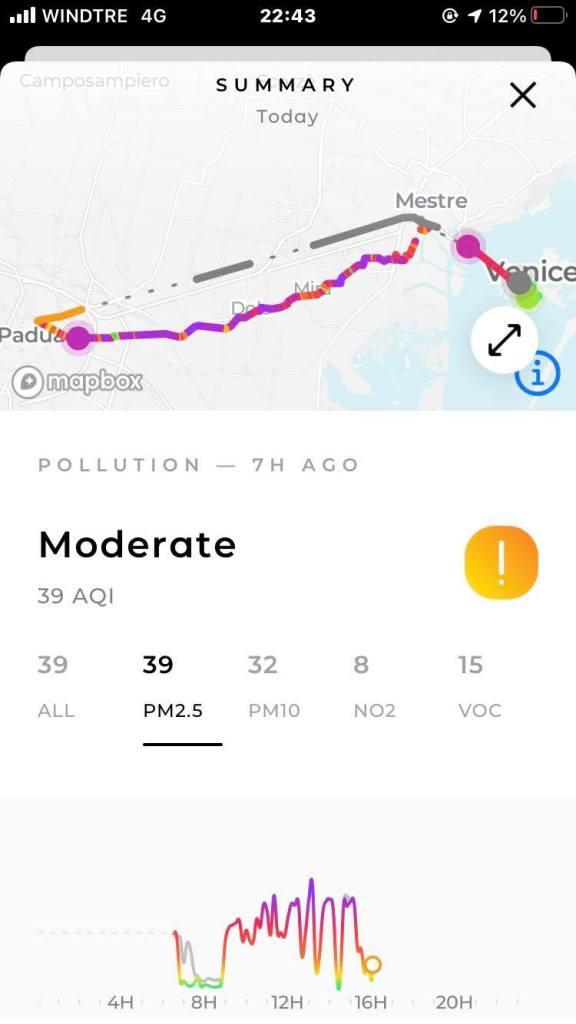

The two graphs above show that Agis had to run on his first day in Italy (Day 9) under pretty polluted air conditions.
The PM2,5 average between the moment Agis started in Venice at 8:57AM and when he finished in Padova at 14:36PM was 59,2 μg/m3. This is a level of Air Pollution six times higher than the safety level set by the WHO, and running under these conditions is unhealthy. Best PM2,5 value was, but just for a very short time, 1,9 μg/m3 and the worse was as high as 188,8 μg/m3.
The surprise we mentioned above is that NO2 pollution was definitely better than particulate pollution, with an average of 30,6 μg/m3, which is below the safety level of 40 μg/m3 set by the WHO. Best value was 3,8 μg/m3 and worse was 99,6 μg/m3.
Some satellite images of Agis’ track on Day 9, between Venezia and Padova:
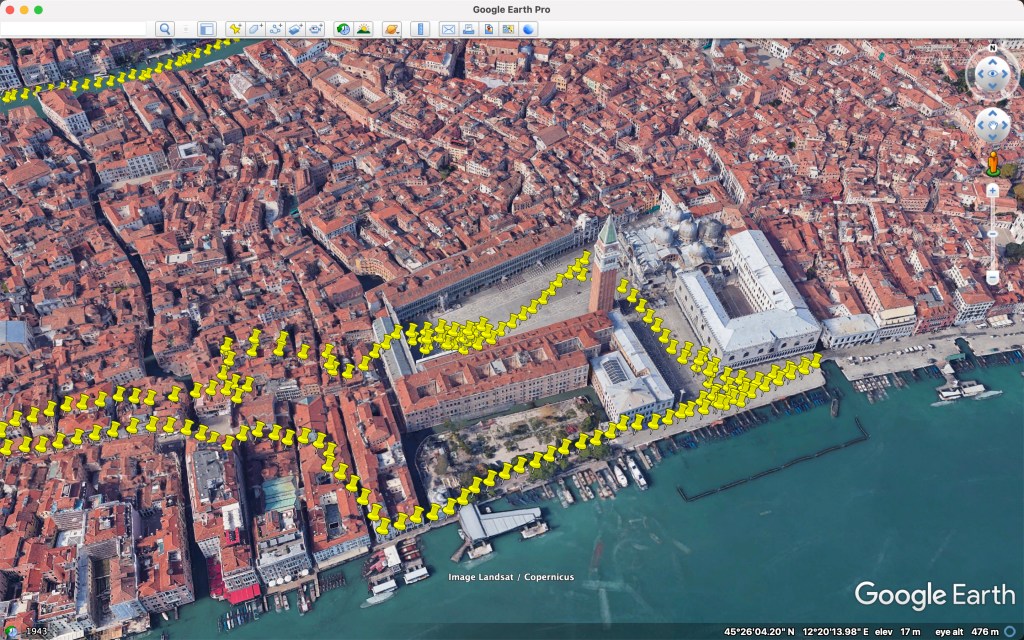
Venezia, Piazza San Marco 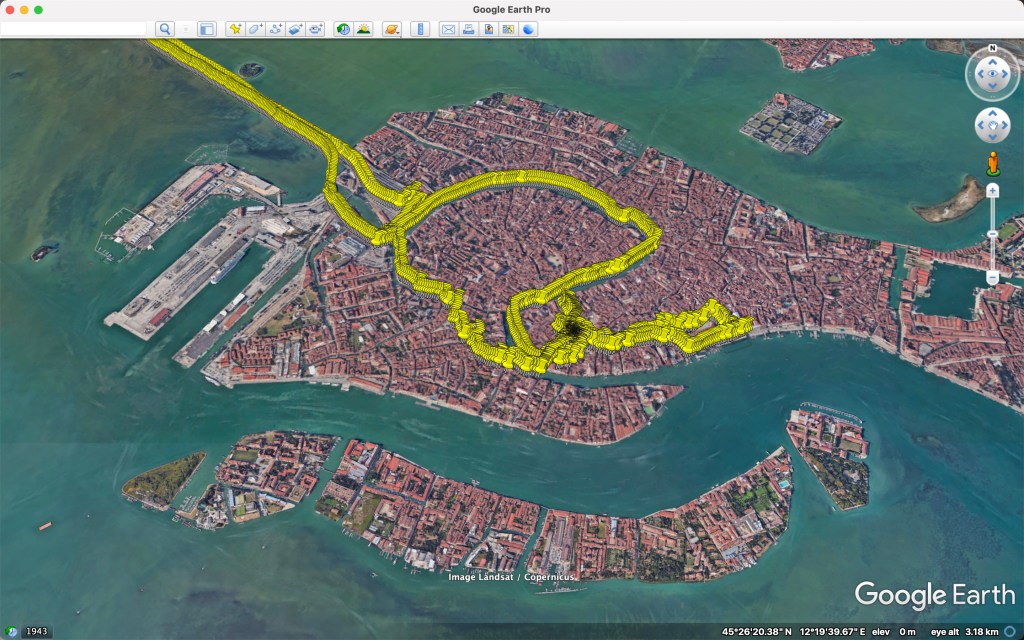
Venezia 
The industrial zone of Marghera, near Venezia 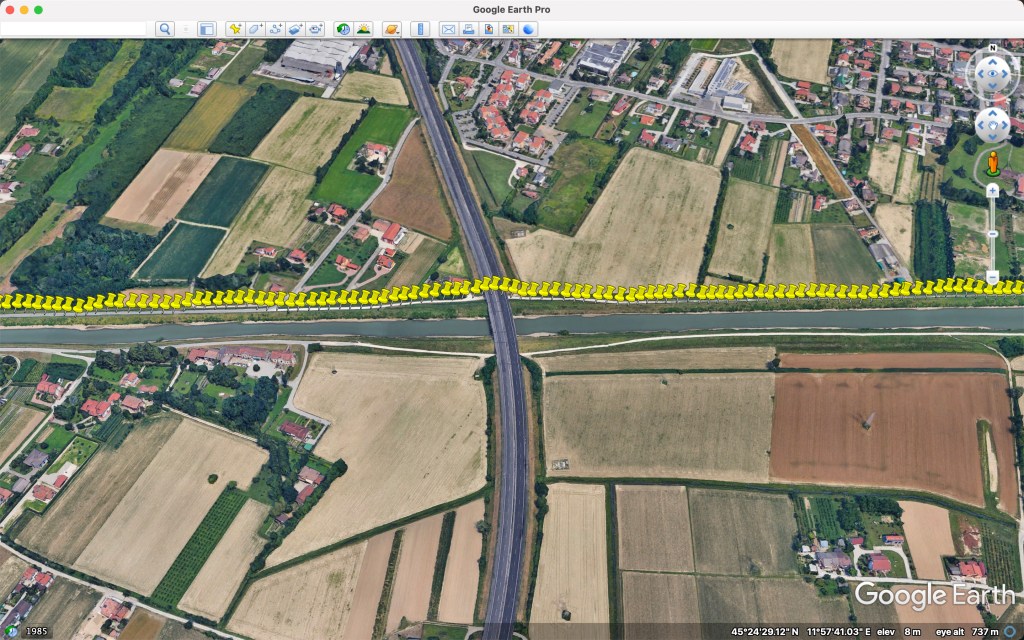
Agis ran most of the way on a smaller road by the river Brenta 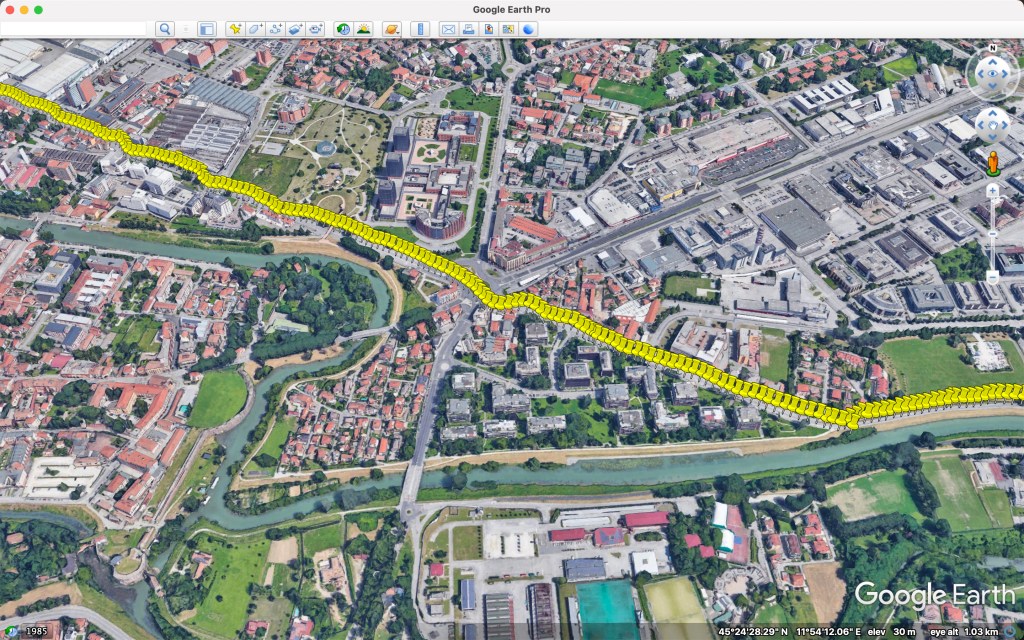
The last stretch before Padova
Day 9 Air Quality stats:
| Low Pollution | High Pollution | Average Pollution | Total | |
| PM2,5 (μg/m3) | 1,9 | 188,8 | 59,2 | |
| NO2 (μg/m3) | 3,8 | 99,6 | 30,6 | |
| KM run | 7,5 | 36 | 43,5 | |
| Running time | 00:50 | 04:49 | 05:39 |
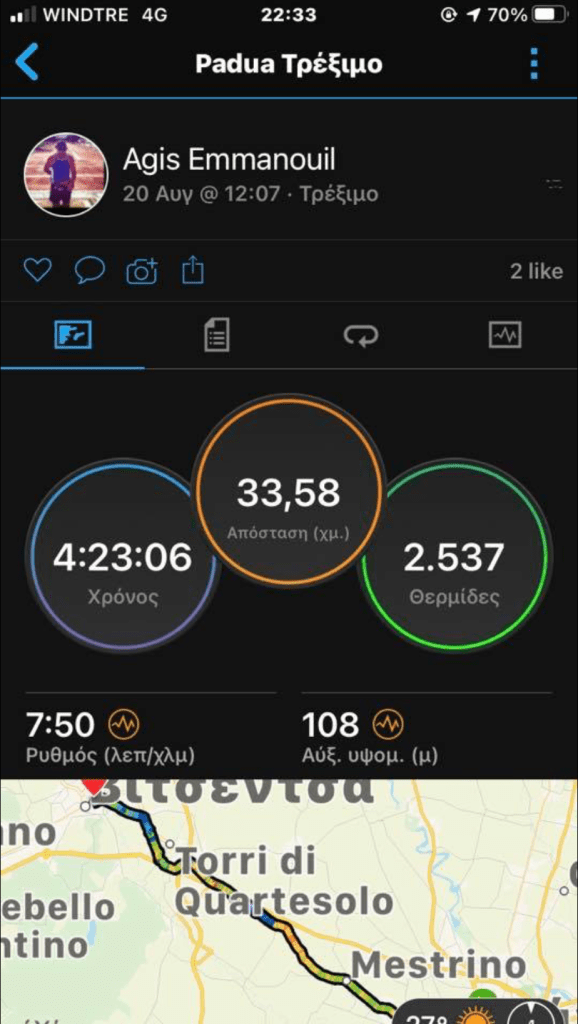
2. Day 10, 20/08/21: Padova-Vicenza, 33,6km, 4:23 hours

Agis’ second day in Italy brought better insights into the Air Quality of the Padania Plain.
Maps and Graphs of Day 10 (2nd running day in Italy):
Here is the map with Agis’ course and running stats for Day 10, Padova-Vicenza:
And here are the screenshots of the Air Quality (AQ) data of the Flow AQ Monitor for PM2,5 (left) and NO2 (right):
The two graphs above show that Agis had to run again under polluted air conditions also on Day 10, on his second day in Italy.
The PM2,5 average between the moment Agis started in Padova at 12:07PM and when he finished in Vicenza at 16:30PM was 46,6 μg/m3. This is a level of Air Pollution almost five times higher than the safety level set by the WHO, and running under these conditions is unhealthy, again. Best PM2,5 value was 1 μg/m3 and the worse was as high as 161,8 μg/m3.
NO2 pollution was somehow better than particulate pollution, but not as good as the previous day. With an average of 53,1 μg/m3, NO2 pollution is above the safety level of 40 μg/m3 set by the WHO. Best value was 0 μg/m3 and worse was 116,6 μg/m3, three times higher than the WHO safety limit.
Some satellite images of Agis’ track on Day 10, between Padova and Vicenza:

The start at Padova 
Villages, farmland and some industries along the way 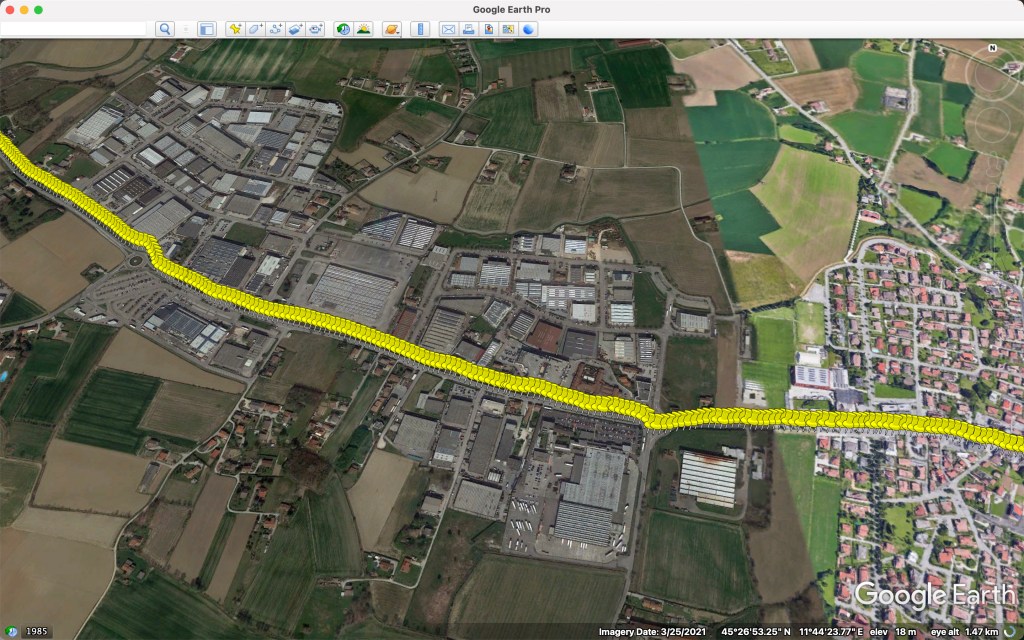
Industries 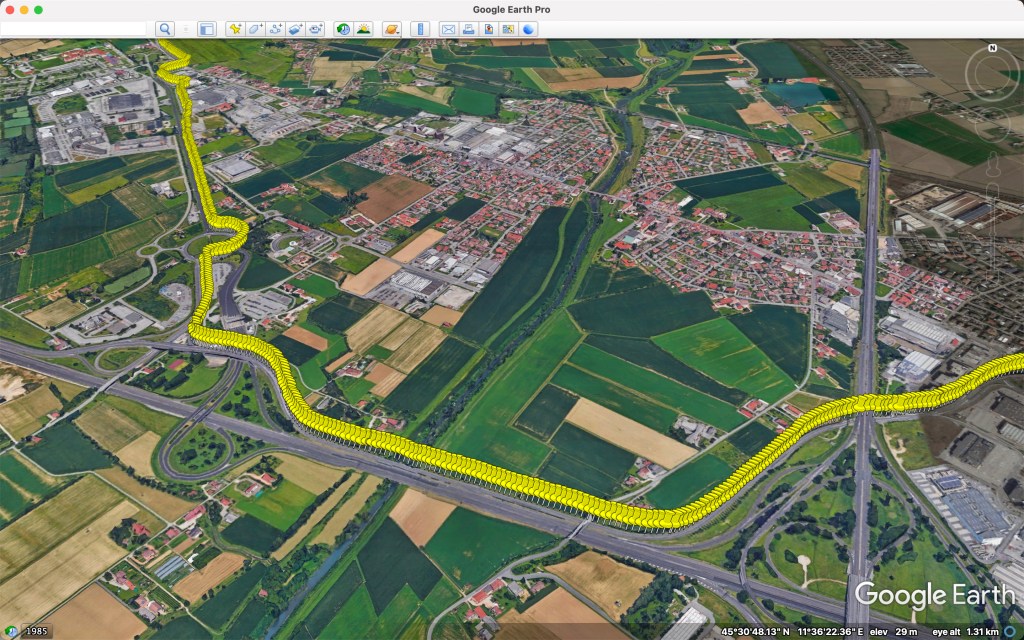
Part of Agis’ track close to the freeway 
The arrival in Vicenza’s historic center
Day 10 Air Quality stats:
| | Low Pollution | High Pollution | Average Pollution | Total |
| PM2,5 (μg/m3) | 1 | 161,8 | 46,6 | |
| NO2 (μg/m3) | 0 | 116,6 | 53,1 | |
| KM run | 15 | 18,6 | | 33,6 |
| Running time | 01:50 | 02:33 | | 04:23 |
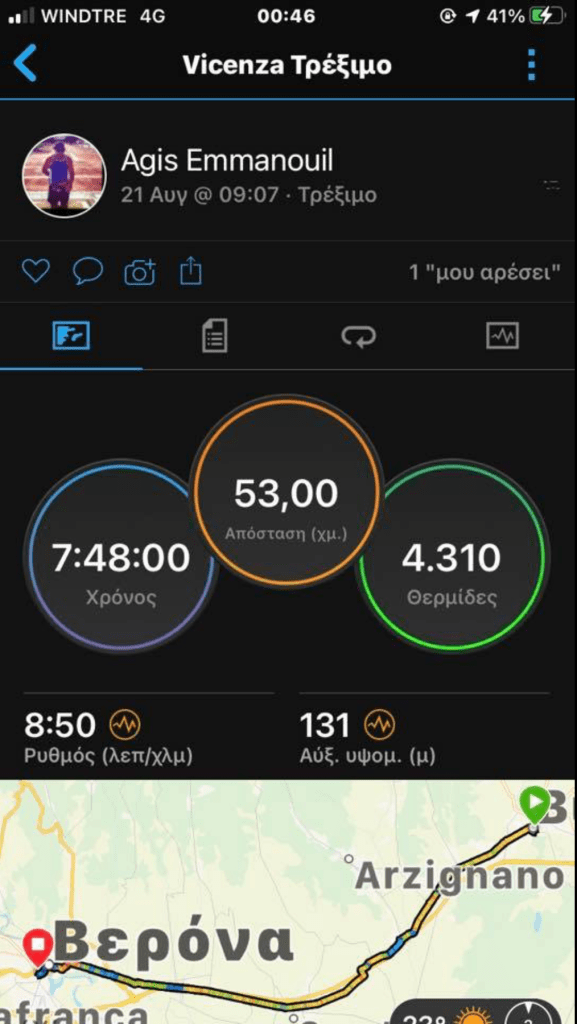
3. Day 11, 21/08/21: Vicenza-Verona, 53km, 7:48 hours

Also Agis’ third day in Italy confirmed the Air Quality problems that afflict the Padania Plain. Once again he had to run under conditions of high Air Pollution, unfortunately.
Maps and Graphs of Day 11 (3rd running day in Italy):
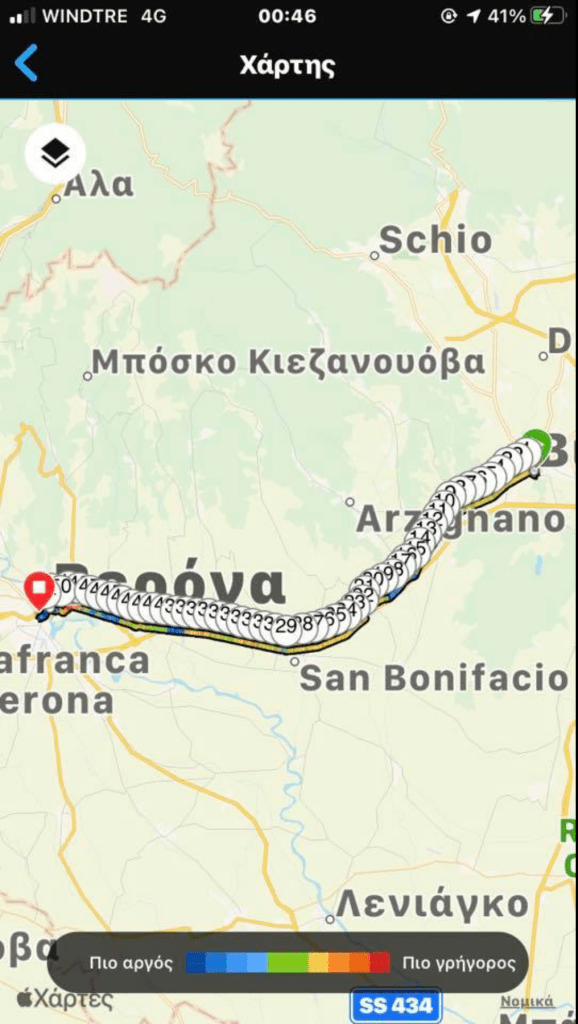
Here is the map with Agis’ course and running stats for Day 11, Vicenza-Verona:
And here is the screenshot of the Air Quality (AQ) data of the Flow AQ Monitor for PM2,5 (there is no NO2 screenshot for Day 11):

The graph above shows that Agis had to run under polluted air conditions also on Day 11, on his third day in Italy.
The PM2,5 average between the moment Agis started in Vicenza at 9:07AM and when he finished in Verona at 16:55PM was 52,7 μg/m3. This is a level of Air Pollution five times higher than the safety level set by the WHO, and running under these conditions is unhealthy. Best PM2,5 value was 1,3 μg/m3 and the worse was as high as 201,4 μg/m3, the worse of all days until now.
NO2 pollution was high too, with an average of 82,7 μg/m3, which is double the safety level of 40 μg/m3 set by the WHO. Best value was 0 μg/m3 and worse was 161,7 μg/m3, four times higher than the WHO safety limit.
Some satellite images of Agis’ track on Day 11, between Vicenza and Verona:


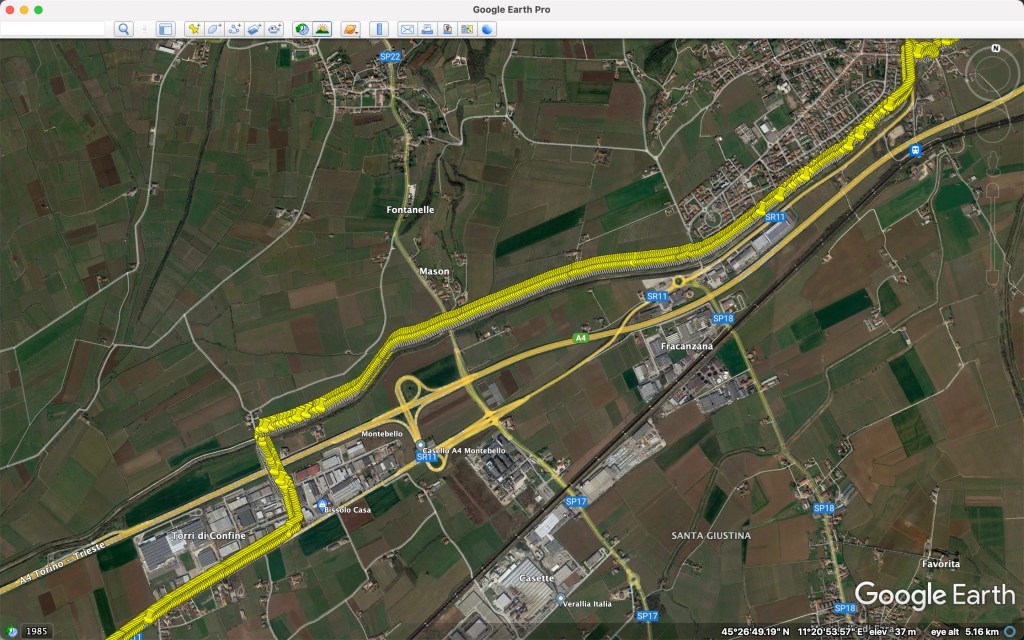
As can be seen in the satellite images above, Agis ran on Day 11 along a State Road that is very close to the A4 Torino-Trieste Freeway. Traffic pollution is very high along both roads, and Agis’ AQ Monitor picked up both particulate and NO2 pollution very well. There are also many industries in the region.
Day 11 Air Quality stats:
| | Low Pollution | High Pollution | Average Pollution | Total |
| PM2,5 (μg/m3) | 1,3 | 201,4 | 52,7 | |
| NO2 (μg/m3) | 0 | 161,7 | 82,7 | |
| KM run | 14 | 39 | | 53 |
| Running time | 02:05 | 05:43 | | 07:48 |
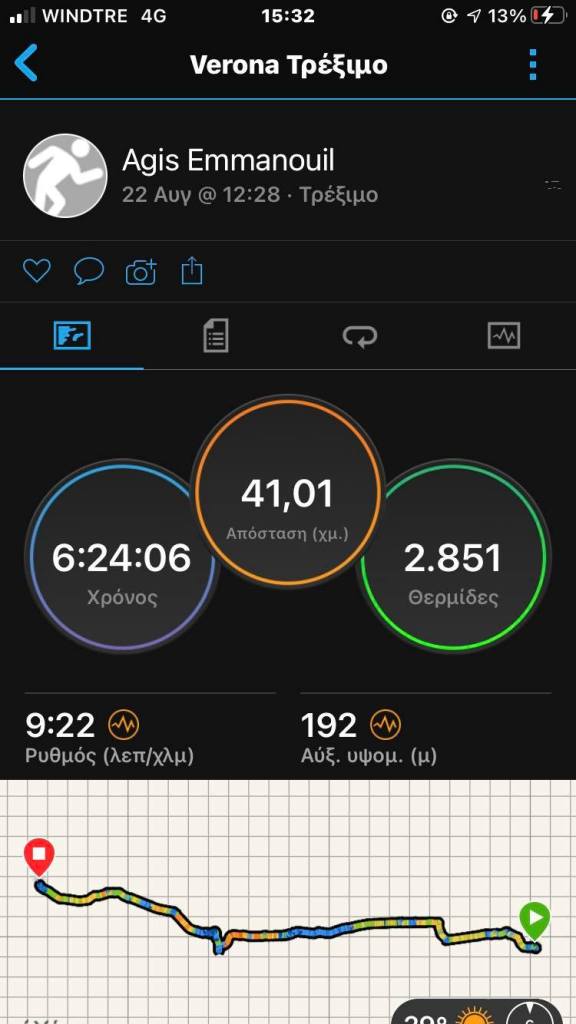
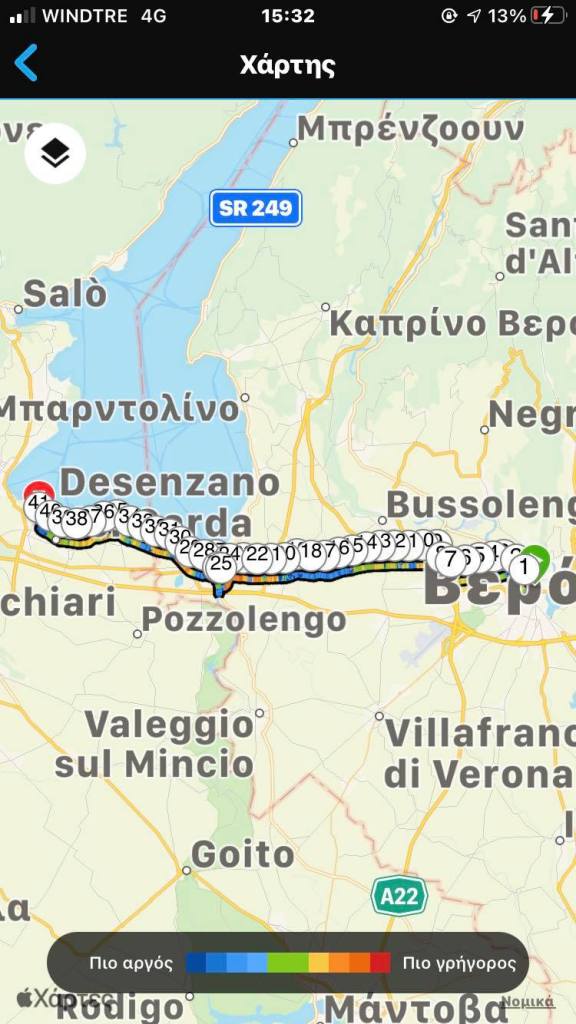
4. Day 12, 22/08/21: Verona-Brescia, 69,2km, 11:30 hours

Agis’ fourth day in Italy was the hardest since the beginning in Athens. He ran for almost 12 hours!
Maps and Graphs of Day 12 (4th running day in Italy):
Here is the map with Agis’ course and running stats for Day 12, Verona-Brescia, with a 2h stop at Desenzano del Garda:


And here are the screenshots of the Air Quality (AQ) data of the Flow AQ Monitor for PM2,5 (left) and NO2 (right):
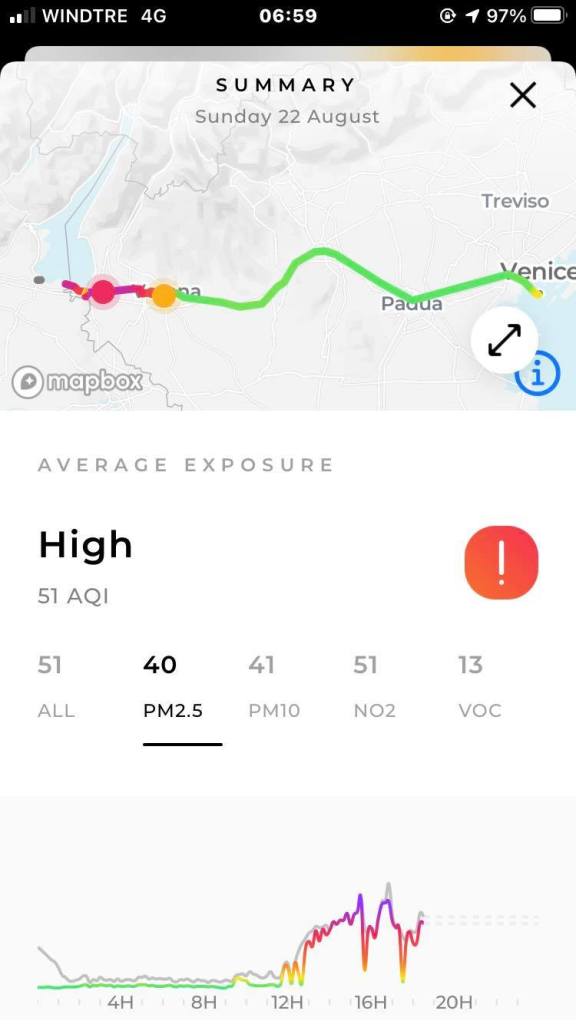

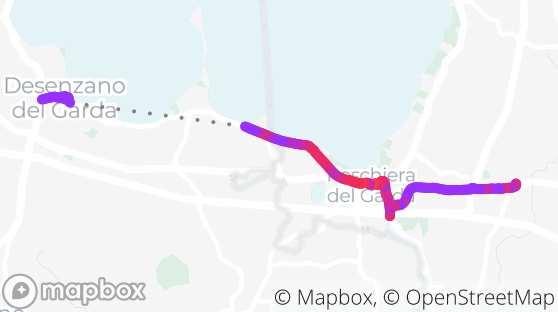
Unfortunately only partial Air Quality data were recorded on Day 12 because of a technical issue with the AQ Monitor/mobile phone connection. As a result of this issue, only the first 16KM (02:11h) out of the total of 69,2KM (11:30h) were recorded by the AQ Monitor.
The graphs and maps above show that Agis had to run under polluted air conditions also on Day 12, on his fourth running day in Italy. This was the worse AQ Agis had encountered on his entire journey since the beginning in Athens.
The PM2,5 average between the moment Agis started in Vicenza at 12:28PM and when the AQ Monitor stopped sending data to the phone along the way at 16:39 was 67 μg/m3. This is a level of Air Pollution almost seven times higher than the safety level set by the WHO!, and running under these conditions is unhealthy, once again. Best PM2,5 value was 2,9 μg/m3 (just for a very short time) and the worse was as high as 222 μg/m3, the worse of all days until now.
NO2 pollution was extremely high too, with an average of 224,8 μg/m3, which is more than five times the safety level of 40 μg/m3 set by the WHO. At these levels NO2 can be easily smelled and even seen as it gives an orange colour to the atmosphere. Best value was 137,2 μg/m3 and worse was 278,2 μg/m3, seven times higher than the WHO safety limit.
Day 12 Air Quality stats:
| | Low Pollution | High Pollution | Average Pollution | Total |
| PM2,5 (μg/m3) | 2,9 | 222 | 67 | |
| NO2 (μg/m3) | 137,2 | 278,2 | 224,8 | |
| KM run | 2,6* | 13,4* | | 16* |
| Running time | 00:22* | 01:49* | | 02:11* |
5. Day 15, 25/08/21: Brescia-Bergamo, 56km, 08:04 hours

Following the previous day’s technical issue with the AQ Monitor/mobile phone connection, unfortunately no Air Quality data were recorded also on Day 15 (the 5th running day in Italy).
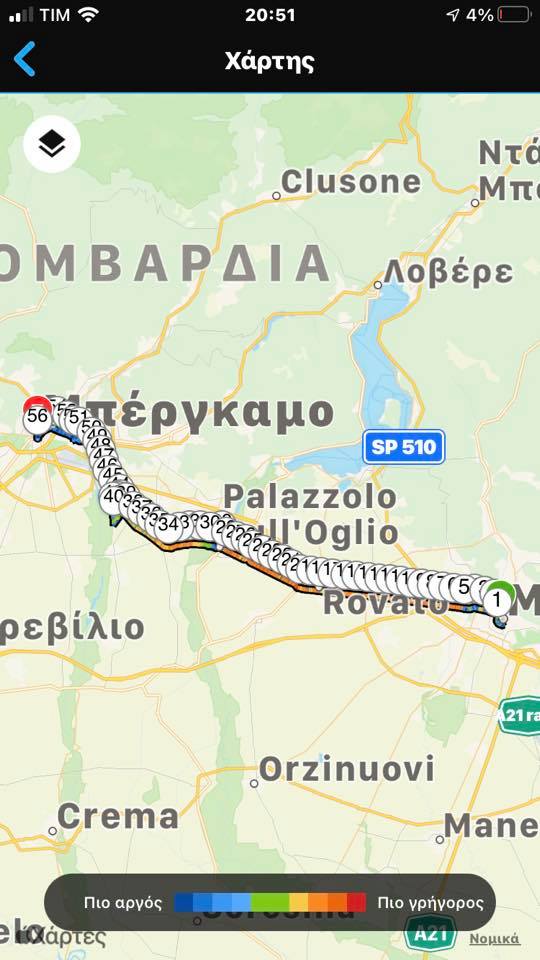
Nevertheless, here is the map with Agis’ course and running stats for Day 15, Brescia-Bergamo:

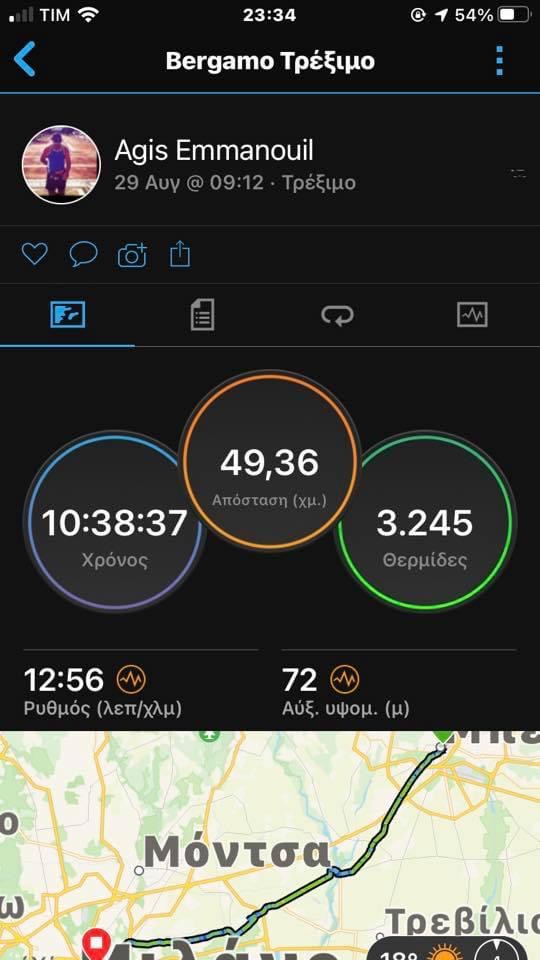
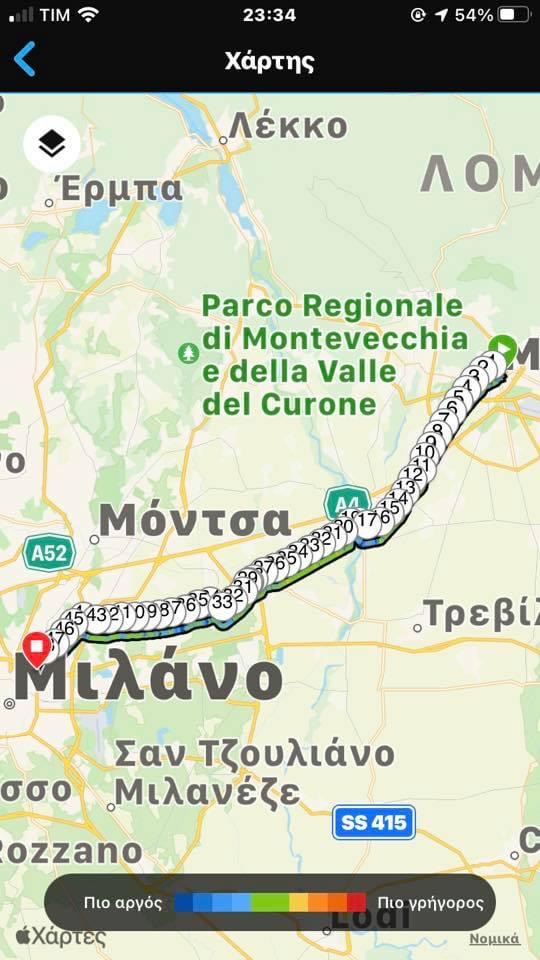
6. Day 19, 29/08/21: Bergamo-Milano, 49,4km, 10:38 hours
Maps and Graphs of Day 19 (6th running day in Italy):
Here is the map with Agis’ course and running stats for Day 19, Bergamo-Milano:
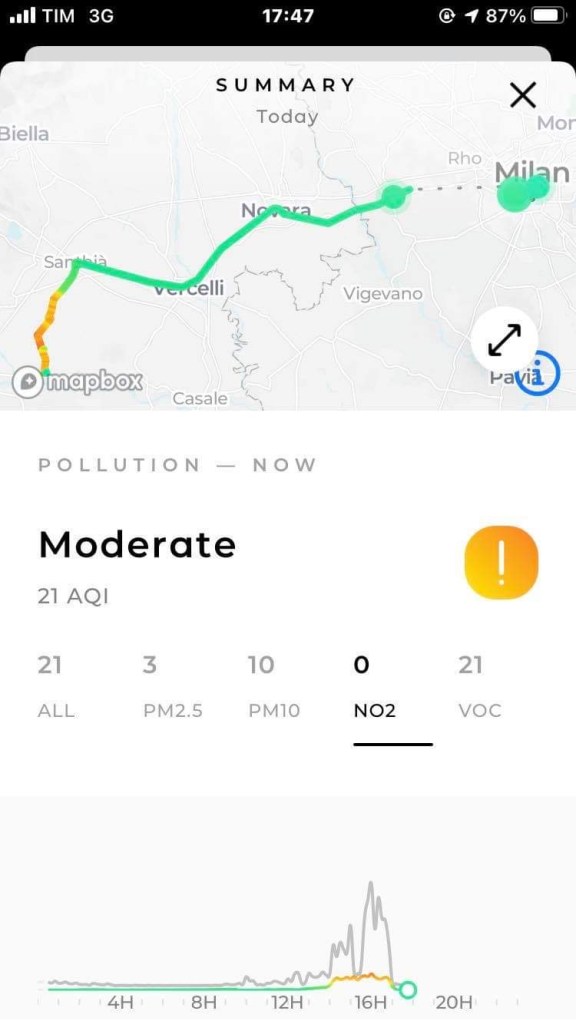
And here are the screenshots of the Air Quality (AQ) data of the Flow AQ Monitor for PM2,5 (left) and NO2 (right):


The two graphs above show that Agis had to run again under polluted air conditions (but better than during the previous days) also on Day 19, on his 6th running day in Italy.
The PM2,5 average between the moment Agis started in Bergamo at 09:12AM and when he finished in Milano at 19:50PM was 27,8 μg/m3. This is a level of Air Pollution almost three times higher than the safety level set by the WHO, and running under these conditions is considered unhealthy, although not as bad as during the previous Italian running days. Best PM2,5 value was 1 μg/m3 and the worse was as high as 159,7 μg/m3.
NO2 was definitely better, with an average of 13,9 μg/m3, which is well below the safety level of 40 μg/m3 set by the WHO. Best value was 0 μg/m3 and worse was 24,4 μg/m3.
Some satellite images of Agis’ track on Day 19, between Bergamo and Milano:
The whole region is a mosaic of industrial, residential and agricultural areas 
Traffic around Milano is very intense with many highways
Day 19 Air Quality stats:
| | Low Pollution | High Pollution | Average Pollution | Total |
| PM2,5 (μg/m3) | 1 | 159,7 | 27,8 | |
| NO2 (μg/m3) | 0 | 24,4 | 13,9 | |
| KM run | 31 | 18,4 | | 49,4 |
| Running time | 07:03 | 03:35 | | 10:38 |
7. Day 20 , 30/08/21: Milano-Arluno, 26km, 04:27 hours

On his 7th running day in Italy, Agis had to slow down his pace and eventually stop running for several days afterwards because of an injury to his left leg. He finished the day in Arluno, midway between Milano and Novara – his original destination for this day. Agis rested and underwent physiotherapy in Milano during the next days.
Maps and Graphs of Day 20 (7th running day in Italy):
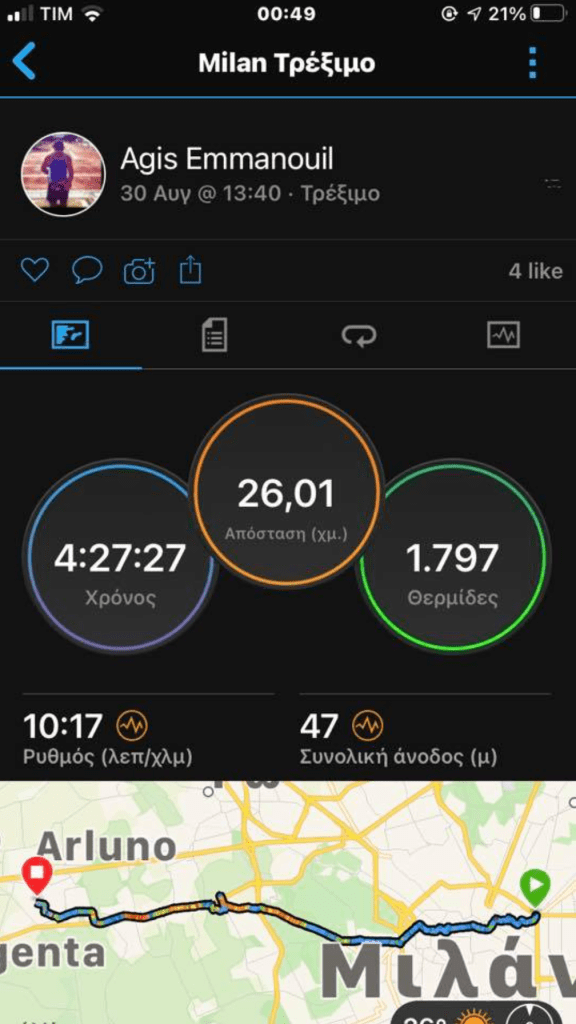
Here is the map with Agis’ course and running stats for Day 20, Milano-Arluno:
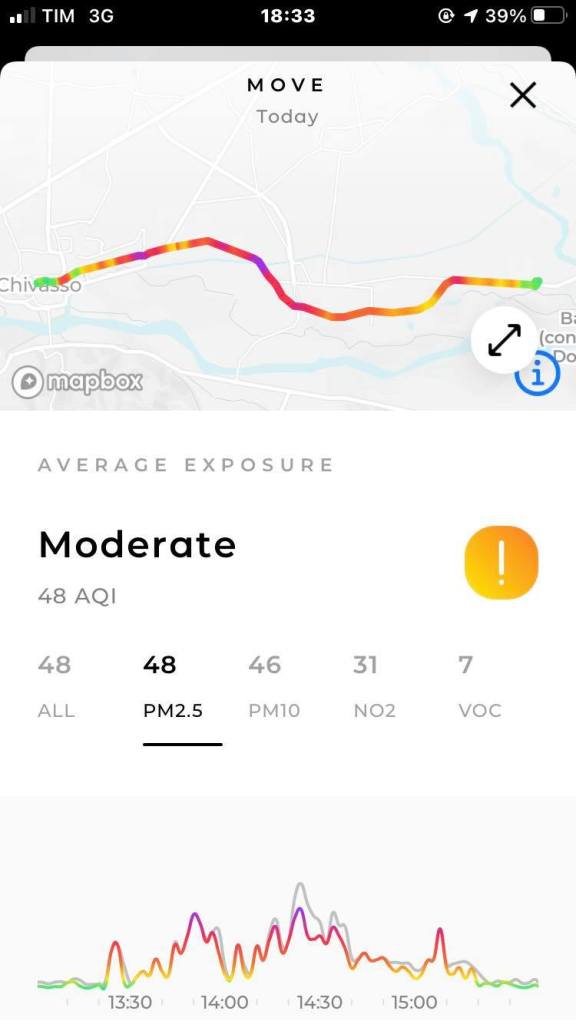
And here are the screenshots of the Air Quality (AQ) data of the Flow AQ Monitor for PM2,5 (left) and NO2 (right):

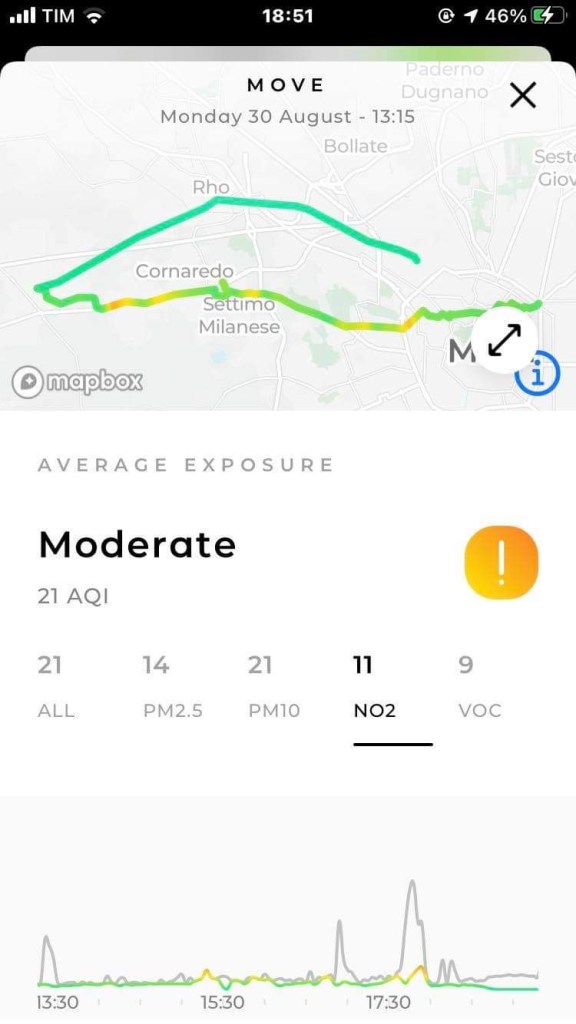
The two graphs above show that on Day 20 Agis finally managed to run under good Air Quality conditions, the best since he started his adventure in Italy!
The PM2,5 average between the moment Agis started in Milano at 13:40PM and when he finished in Arluno at 18:07PM was 9,7 μg/m3. This is a level of Air Pollution that lies within the safety level set by the WHO (10 μg/m3), and running under these conditions is considered healthy, at last! Best PM2,5 value was 1 μg/m3 and the worse was as high as 221,1 μg/m3.
NO2 was also within safety levels, with an average of 16,3 μg/m3. Best value was 0 μg/m3 and worse was 71,4 μg/m3.
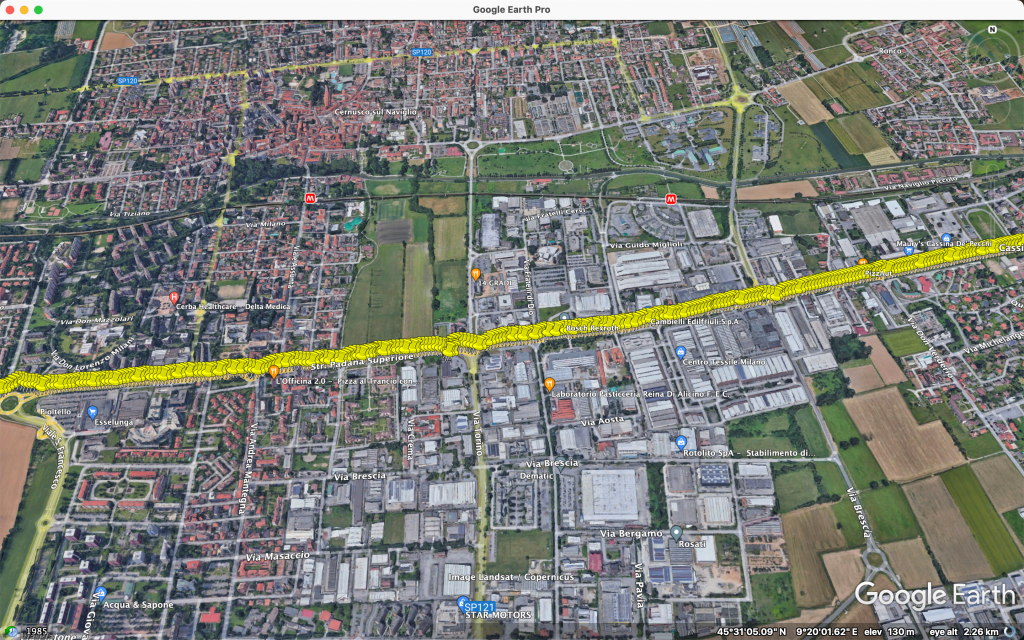
Some satellite images of Agis’ track on Day 20, between Milano and Arluno:

Piazzale Loreto, Milano 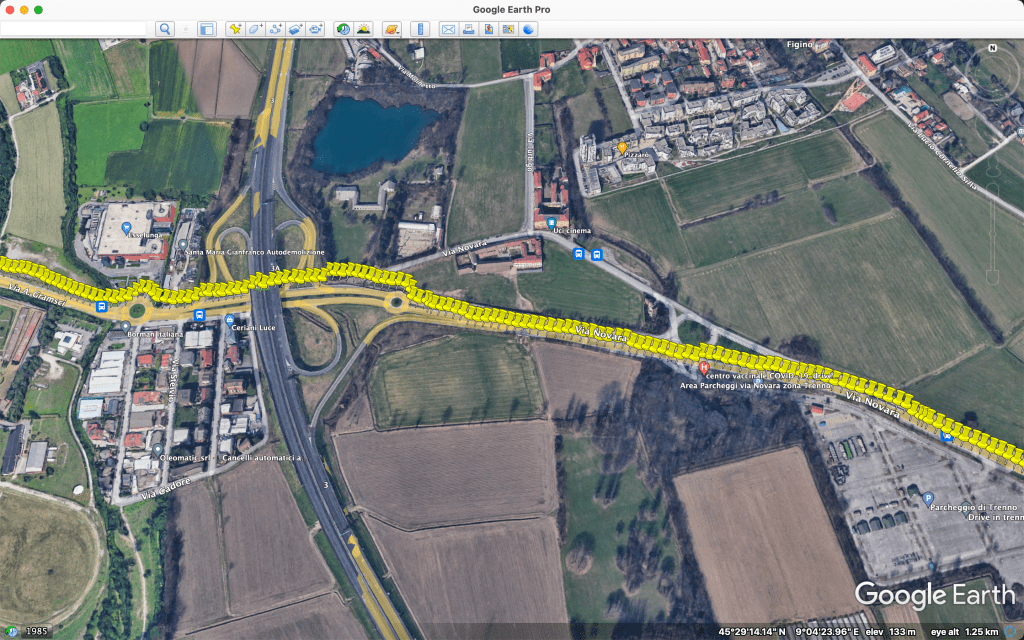
Agricultural and residential land W of Milano 
The industrial area where the AQ Monitor picked up very high pollution values.
For most of the day Agis run among agricultural land and residential areas, where the Air Quality was excellent. But around half the way, he crossed an industrial area that must be polluting the surrounding area quite a lot, and Agis’ small AQ Monitor picked up the big difference quite effectively. This is a clear example of how Air Pollution is very often a localized problem. With the knowledge we have nowadays about the deleterious effects of Air Pollution on our health, it should not be tolerated anymore to have such a polluting industrial area so close to a residential area. It should be a priority of any local authorities to address and solve the problem in order to protect the local population.
Day 20 Air Quality stats:
| | Low Pollution | High Pollution | Average Pollution | Total |
| PM2,5 (μg/m3) | 1 | 221,1 | 9,7 | |
| NO2 (μg/m3) | 0 | 71,4 | 16,3 | |
| KM run | 23 | 3 | | 26 |
| Running time | 04:07 | 00:20 | | 04:27 |
8. Day 25 , 04/09/21: Arluno-Novara, 30km, 04:45 hours
After four days of rest and physiotherapy in Milano, Agis started his 8th Italian running day in Arluno in order to finish the Milano-Novara stretch. Fortunately his leg didn’t give in this time!
Maps and Graphs of Day 25 (8th running day in Italy):
Here is the map with Agis’ course and running stats for Day 20, Milano-Arluno:


And here are the screenshots of the Air Quality (AQ) data of the Flow AQ Monitor for PM2,5 (left) and NO2 (right):
The two graphs above show that Agis ran on Day 26 under very good Air Quality conditions.
The PM2,5 average between the moment Agis started in Milano at 14:05PM and when he finished in Milano at 18:50PM was as low as 5,2 μg/m3, the best since his start in Athens. This is again a level of Air Pollution that lies well within the safety level set by the WHO (10 μg/m3), and running under these conditions is perfectly healthy. Best PM2,5 value was 1 μg/m3 and the worse was just 20,1 μg/m3.
NO2 was also well within safety levels, with an average of only 4,5 μg/m3. Best value was 0 μg/m3 and worse was 15 μg/m3.
Some satellite images of Agis’ track on Day 25, between Arluno and Novara:

Agricultural land along the way 
Running by Trecate, a typical small rural city of the Lombardia Region 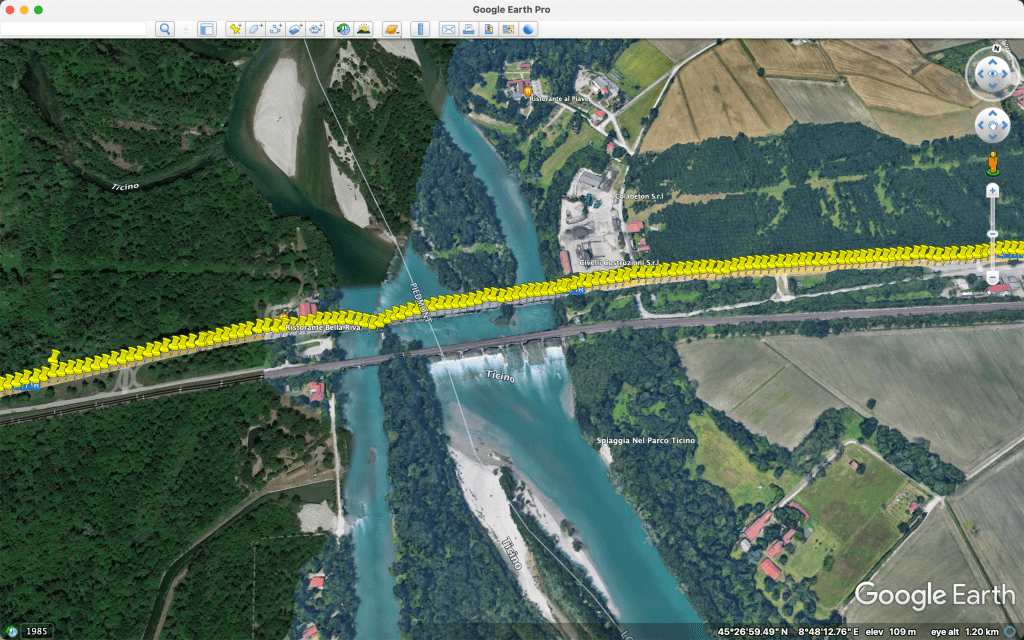
Crossing the Ticino river, between the regions of Lombardia and Piemonte
Day 25 Air Quality stats:
| | Low Pollution | High Pollution | Average Pollution | Total |
| PM2,5 (μg/m3) | 1 | 20,1 | 5,2 | |
| NO2 (μg/m3) | 0 | 15 | 4,5 | |
| KM run | 30 | 0 | | 30 |
| Running time | 04:45 | 00:00 | | 04:45 |
9. Day 26 , 05/09/21: Novara-Santhia’, 45,7km, 07:07 hours
Maps and Graphs of Day 26 (9th running day in Italy):
Here is the map with Agis’ course and running stats for Day 26, Novara-Santhia’:


And here are the screenshots of the Air Quality (AQ) data of the Flow AQ Monitor for PM2,5 (left) and NO2 (right):
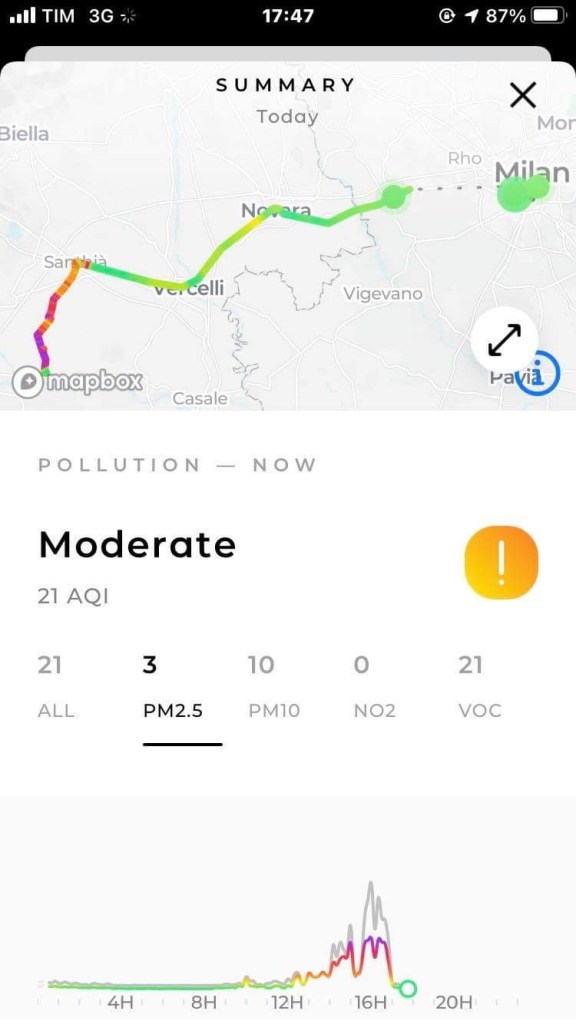
The two graphs above show that Agis ran on Day 26 under acceptable Air Quality conditions, but not as good as during the previous two days.
The PM2,5 average between the moment Agis started in Novara at 13:02PM and when he finished in Santhia’ at 20:09PM was 15,7 μg/m3. This is a level of Air Pollution that while it is 1,5 times higher than the safety level set by the WHO (10 μg/m3), is still considered safe by the EU standards (which sets the safety limit at 25 μg/m3). Yet, research shows that every increase of even 1 μg/m3 has an impact on our health, and that anything above 10 μg/m3 may cause harm. It follows that the EU should adopt stricter AQ standards! Best PM2,5 value was 1,2 μg/m3 and the worse was 120,7 μg/m3.
NO2 was stilll within safety levels, with an average of 31,4 μg/m3. Best value was 0 μg/m3 and worse was 116,6 μg/m3.
Some satellite images of Agis’ track on Day 26, between Novara and Santhia’:

Novara 
Thousands of hectares of rice fields lie around Novara and Vercelli 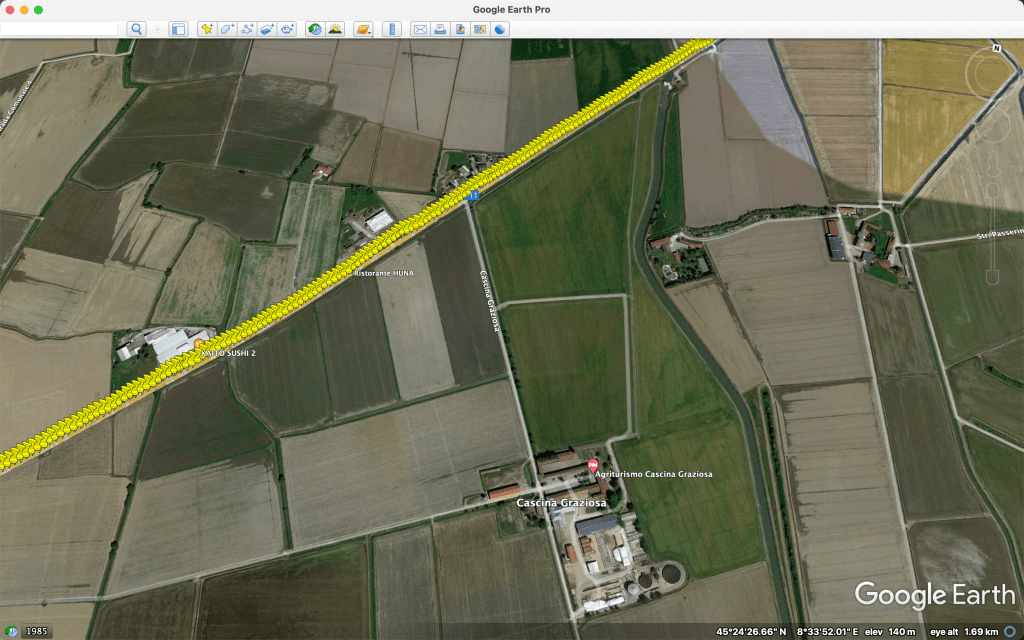
A closer looks at the rice fields
Agis started in Novara with relatively high levels of Air Pollution. But as soon as he distanced himself from the city and began running among agricultural land, the Air Quality improved to good levels. We all know that urban areas with their thousands of fossil fuels burning vehicles are a big source of Air Pollution, and this example makes it very clear. As a matter of fact, if we decided to suddenly stop burning fossil fuels in our cities, the Air Quality would tremendously improve overnight! And of course we would also drastically reduce the amount of CO2 that we pour into the atmosphere daily.
Day 26 Air Quality stats:
| | Low Pollution | High Pollution | Average Pollution | Total |
| PM2,5 (μg/m3) | 1,2 | 120,7 | 15,7 | |
| NO2 (μg/m3) | 0 | 116,6 | 31,4 | |
| KM run | 35,7 | 10 | | 45,7 |
| Running time | 05:27 | 01:40 | | 07:07 |
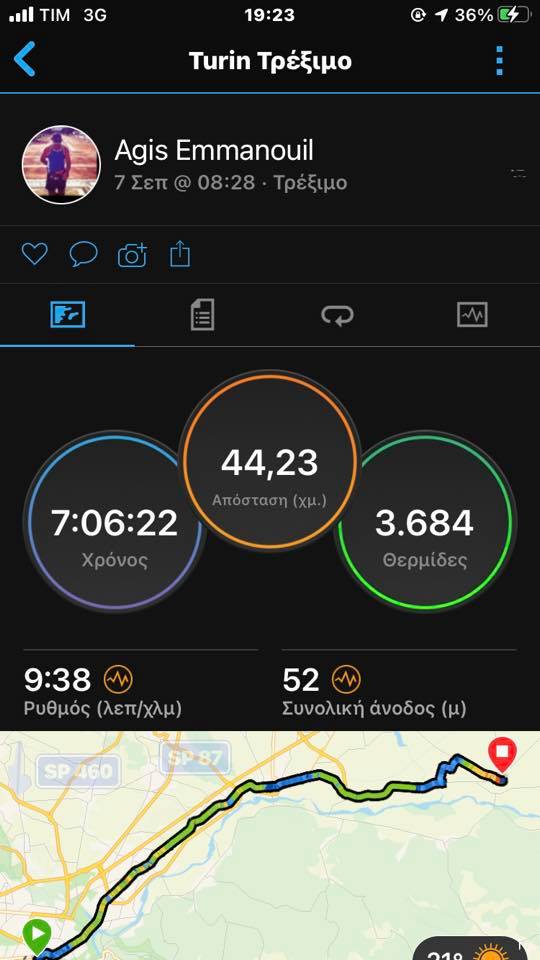
10. Day 28 , 07/09/21: Torino-Crescentino, 44,2km, 07:06 hours
Agis program for Day 28 was to run from Torino to Santhia’, but because of an injury (to his right leg this time) he had to end the day along the way in Crescentino, after 44km.
Maps and Graphs of Day 28 (10th running day in Italy):
Here is the map with Agis’ course and running stats for Day 28, Torino-Crescentino:
And here are partial screenshots of the Air Quality (AQ) data of the Flow AQ Monitor for PM2,5 (left) and NO2 (right):

Agis ran on Day 28 under acceptable Air Quality conditions, but worse that the previous days. It looks as if the Air Quality along Agis’ journey is worsening again.
The PM2,5 average between the moment Agis started in Torino at 08:28PM and when he finished in Crescentino at 15:34PM was 22,7 μg/m3. This is a level of Air Pollution twice as much as the safety level set by the WHO (10 μg/m3). Best PM2,5 value was 1 μg/m3 and the worse was 105,1 μg/m3.
NO2 was stilll within safety levels, with an average of 39,1 μg/m3. Best value was 0 μg/m3 and worse was 156 μg/m3.
Some satellite images of Agis’ track on Day 28, between Torino and Crescentino:

Torino 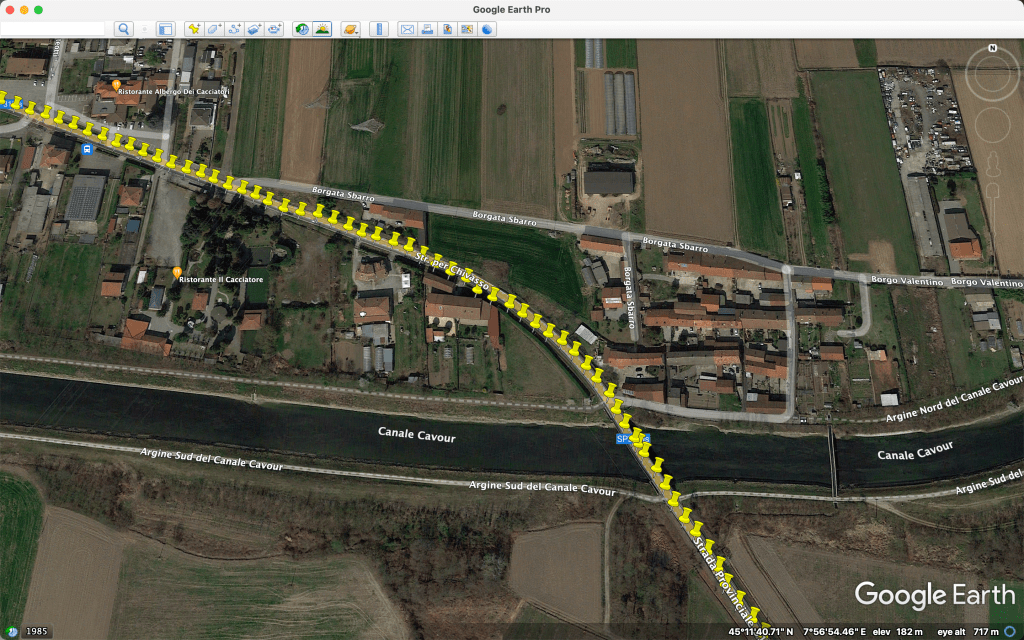
Crossing Canale Cavour, the third longest Italian canal, which feeds thousands of rice fields in the region 
Agis’ initial part of the track was once again close to the trafficked freeway
Once again, Agis ran along very trafficked roads on Day 28 (for about half of the way), and the AQ monitor picked up the pollution.
Day 28 Air Quality stats:
| | Low Pollution | High Pollution | Average Pollution | Total |
| PM2,5 (μg/m3) | 1 | 105,1 | 22,7 | |
| NO2 (μg/m3) | 0 | 156 | 39,1 | |
| KM run | 18,2 | 26 | | 44,2 |
| Running time | 02:55+ | 04:11+ | | 07:06 |
+ Looking at the table above, it seems that the time that Agis ran under high pollution is too high if we consider that both the averages of PM2,5 and NO2 are relatively low. The fact is that during this particular stretch, although PM2,5 pollution was low during the last hour of run, NO2 was very high. It follows that the overall time that Agis ran with clean air was reduced by one hour.
Often NO2 Pollution can be high even when particulate PM2,5 is low, and this is even more true where most vehicles have newer diesel engines. NO2 pollution has increased dramatically since the 90’s, when governments and car manufacturers started pushing us to buy diesel cars with the pretext that they were more fuel efficient and therefore better because they emit less CO2 into the atmosphere compared to petrol cars. As a result, now urban regions in most of Europe have serious NO2 pollution, and the Padania Plain is one of the most affected. And also rural areas are affected because NO2 can travel far from its source, so it can pollute much bigger areas than those from where the pollution originates.
Check the video below to see how the exhaust pipe of an Euro 6 diesel engine (the newest) at throttle emits amounts of particulate PM2,5 and PM10 that are within the safety limits, but how much NO2 it emits instead! Look at the numbers towards the end of the video when the application updates the data sent by the Flow AQ monitor placed by the exhaust: the NO2 AQ index suddenly jumps from 12 to 169, while the particulate PM2,5 remains the same at 4. Diesel cars are big NO2 polluters! Plus, we don’t know how much dangerous the ultrafine particulate their catalytic converter produce in the braking down of the PM2,5 and PM10 yet.
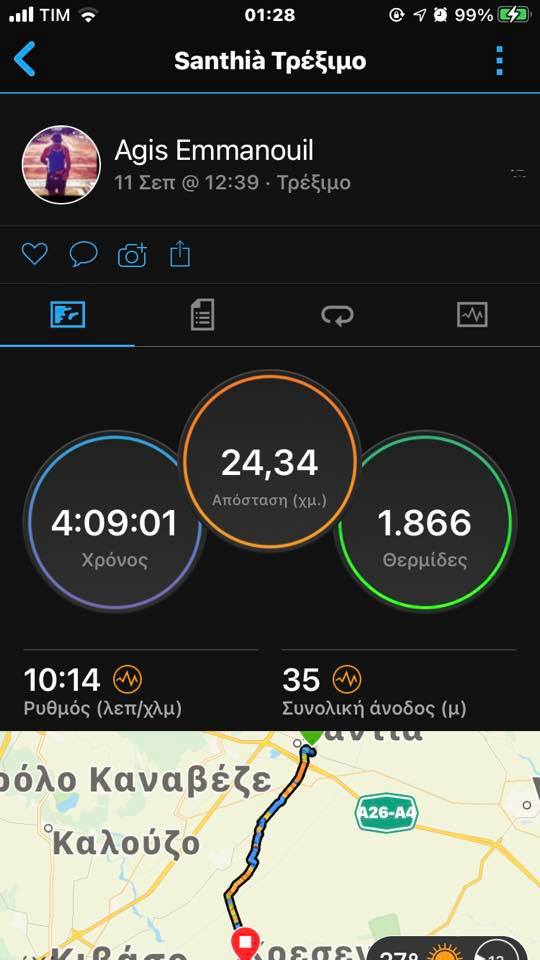
11. Day 32 , 11/09/21: Santhia’-Crescentino, 24,3km, 04:09 hours

After three days of rest and physiotherapy, Agis ran between Santhia’ and Crescentino in order to finish the Torino-Santhia’ stretch.
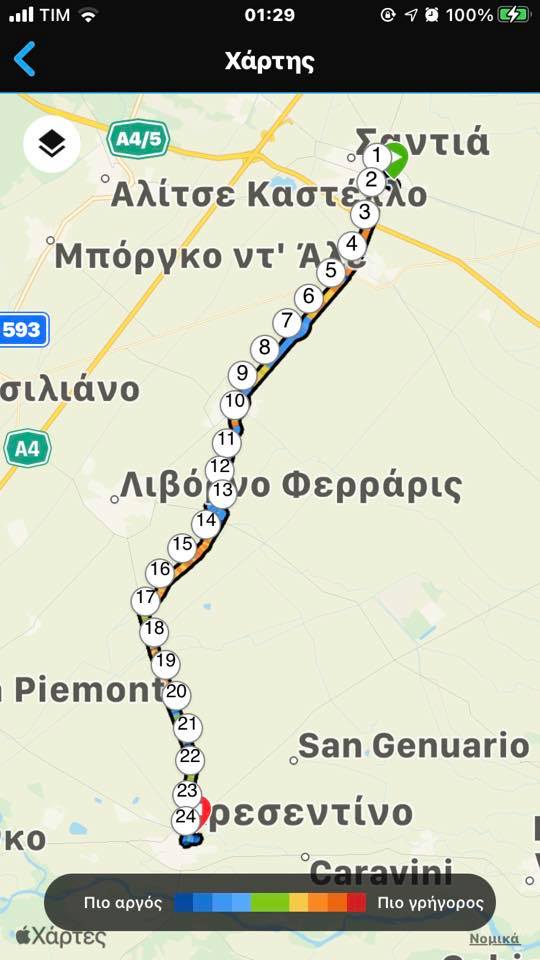
Maps and Graphs of Day 32 (11th running day in Italy):
Here is the map with Agis’ course and running stats for Day 32, Santhia’-Crescentino:
And here are the screenshots of the Air Quality (AQ) data of the Flow AQ Monitor for PM2,5 (left) and NO2 (right):

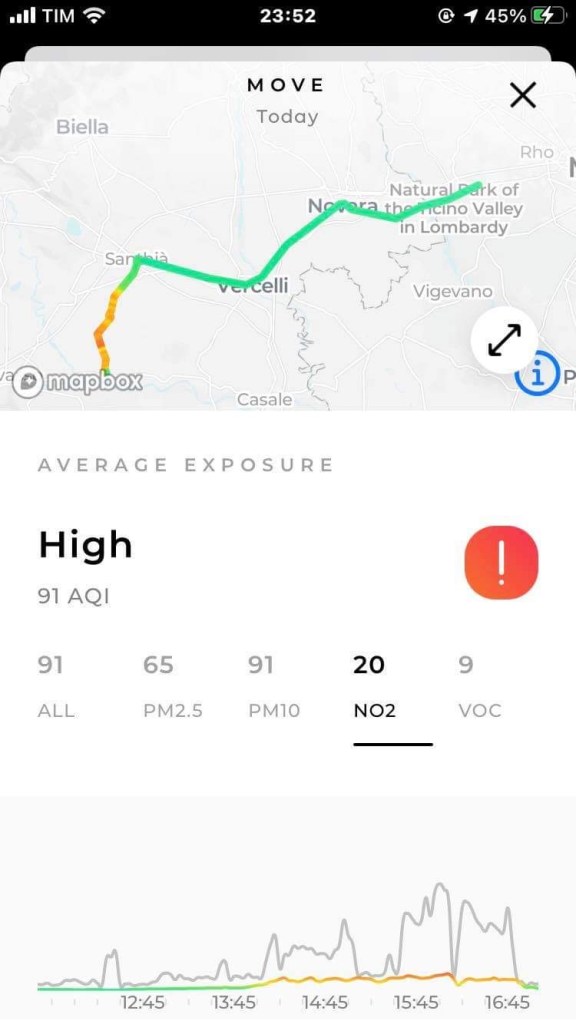
The two graphs above show that Agis ran on Day 32 again under relatively unhealthy Air Quality conditions.
The PM2,5 average between the moment Agis started in Santhia’ at 12:39PM and when he finished in Crescentino at 16:48PM was 34,3 μg/m3. This level of Air Pollution is more than three times higher than the safety level set by the WHO (10 μg/m3), and running under these conditions is not healthy. Best PM2,5 value was 1 μg/m3 and the worse was 120,3 μg/m3.
NO2 was within the safety levels, with an average of 32,5 μg/m3. Best value was 0 μg/m3 and worse was 88,4 μg/m3.
Some satellite images of Agis’ track on Day 32, between Santhia’ and Crescentino:


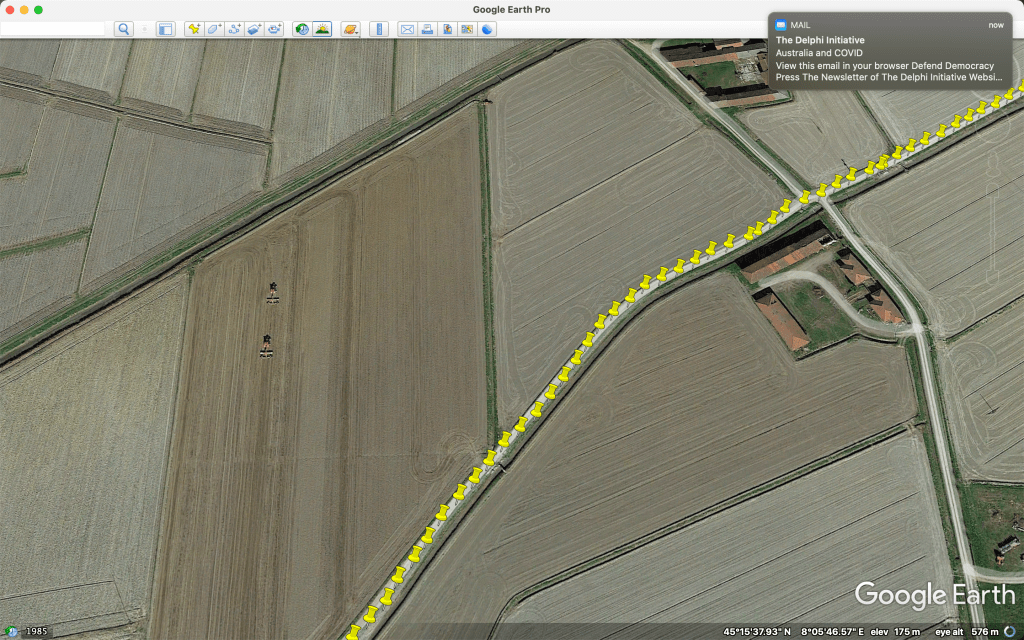
As it is visible from the satellites image above, Agis’ stretch on Day 32 between Santhia’ and Crescentino was different from the previous ones because it was going all along a smaller local road without car traffic and entirely surrounded by fields. I suspect that the higher PM2,5 is due to dust originating from the fields, which in August are dry, and not from vehicle traffic, nor from industries.
Day 32 Air Quality stats:
| | Low Pollution | High Pollution | Average Pollution | Total |
| PM2,5 (μg/m3) | 1 | 120,3 | 34,3 | |
| NO2 (μg/m3) | 0 | 88,4 | 32,5 | |
| KM run | 12 | 12,3 | | 24,3 |
| Running time | 01:59 | 02:10 | | 04:09 |
12. Day 33 , 12/09/21: Torino-Susa, 55,2km, 07:59 hours
On Day 12 in Italy (Day 33 from the the start in Athens), Agis finally left the wide, flat Padania Plain behind and started running in the Susa Valley upwards until Bardonecchia, his last Italian stop before France.
Maps and Graphs of Day 33 (12th running day in Italy):
Here is the map with Agis’ course and running stats for Day 33, Torino-Susa:


And here are the screenshots of the Air Quality (AQ) data of the Flow AQ Monitor for PM2,5 (left) and NO2 (right):


The two graphs above show that Agis ran on Day 33 again under slightly unhealthy Air Quality conditions.
The PM2,5 average between the moment Agis started in Torino at 11:35PM and when he finished in Susa at 19:44PM was 11,4 μg/m3. This level of Air Pollution is very close to the safety level set by the WHO (10 μg/m3), and running under these conditions can still be considered healthy. Best PM2,5 value was 2,4 μg/m3 and the worse was 106,1 μg/m3.
NO2 was just above the safety levels too, with an average of 48,9 μg/m3. Best value was 0 μg/m3 and worse was 131,6 μg/m3.
Some satellite images of Agis’ track on Day 33, between Torino and Susa:
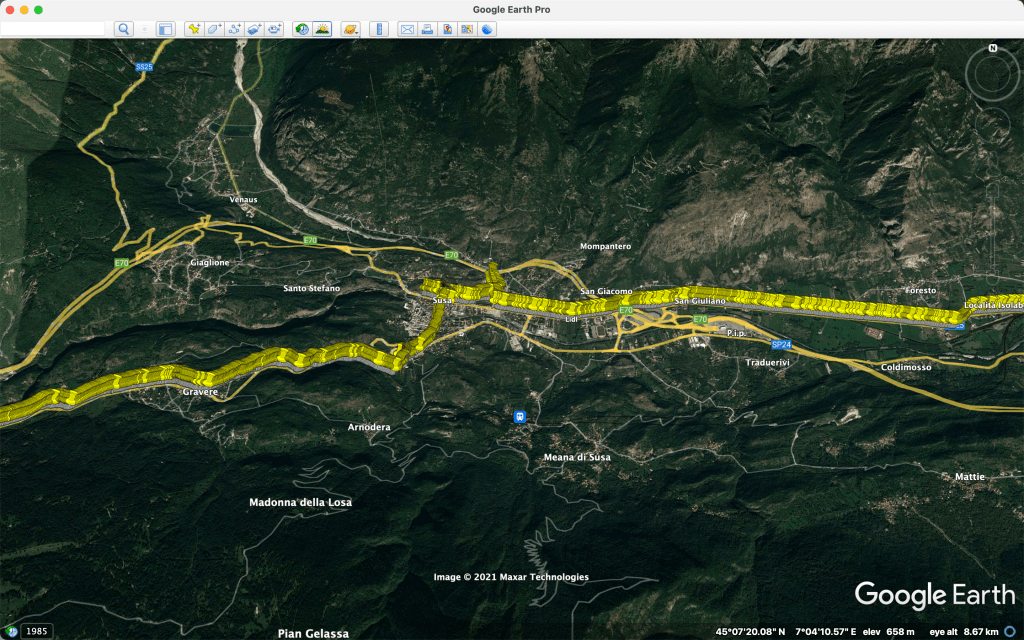
From the satellite photos above, we can see that starting on Day 33 the Padania Plain has finally given way to a green, forested Alpine valley. We expected better Air Quality from this day onwards. And, in fact, particulate and NO2 pollution were lower in this day compared to Agis’ previous days in the Piemonte Region, but still not good enough. Why? Because traffic in the Susa valley is very high, since it is one of the few crossroads between Italy and France through the Alps. The Frejus tunnel between Bardonecchia (I) and Modane (F) is used by thousands of cars and heavy trucks daily, which can cause a very high Air Pollution at times. This is a serious problem found in all those Alpine valleys that have freeways and tunnels, which are used as crossways between the two sides of the mountains.
Day 33 Air Quality stats:
| | Low Pollution | High Pollution | Average Pollution | Total |
| PM2,5 (μg/m3) | 2,4 | 106,1 | 11,4 | |
| NO2 (μg/m3) | 0 | 131,6 | 48,9 | |
| KM run | 24,2 | 31 | | 55,2 |
| Running time | 03:18 | 04:41 | | 07:59 |
13. Day 34 , 13/09/21: Susa-Bardonecchia, 36,5km, 05:56 hours

On Day 13 in Italy (Day 34 from the beginning in Athens), Agis arrived to Bardonecchia and finally ended his Italian run. Ready to cross the Alps into France!
Maps and Graphs of Day 34 (13th and last running day in Italy):
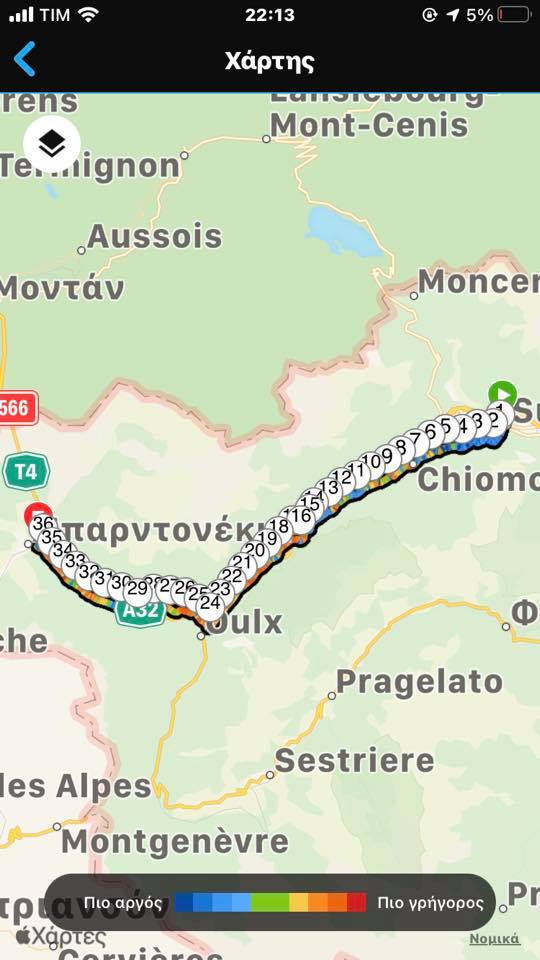
Here is the map with Agis’ course and running stats for Day 34, Susa-Bardonecchia:

And here are the screenshots of the Air Quality (AQ) data of the Flow AQ Monitor for PM2,5 (left) and NO2 (right):
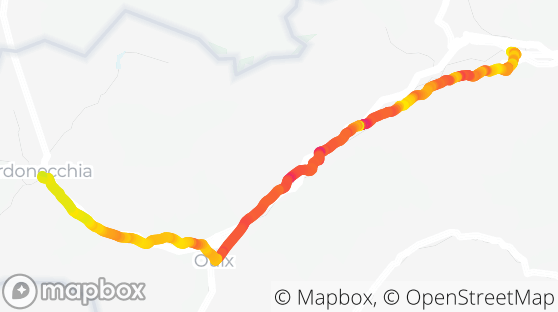
The AQ map above shows that Agis ran on Day 34 again under unhealthy Air Quality conditions.
The PM2,5 average between the moment Agis started in Susa at 11:00PM and when he finished in Bardonecchia at 16:56PM was 18,1 μg/m3. This level of Air Pollution is almost double than the safety level set by the WHO (10 μg/m3), and running under these conditions is not very healthy. Best PM2,5 value was 1 μg/m3 and the worse was 116,2 μg/m3.
NO2 was above safety levels too, with an average of 67,3 μg/m3. Best value was 5,6 μg/m3 and worse was 137,2 μg/m3.
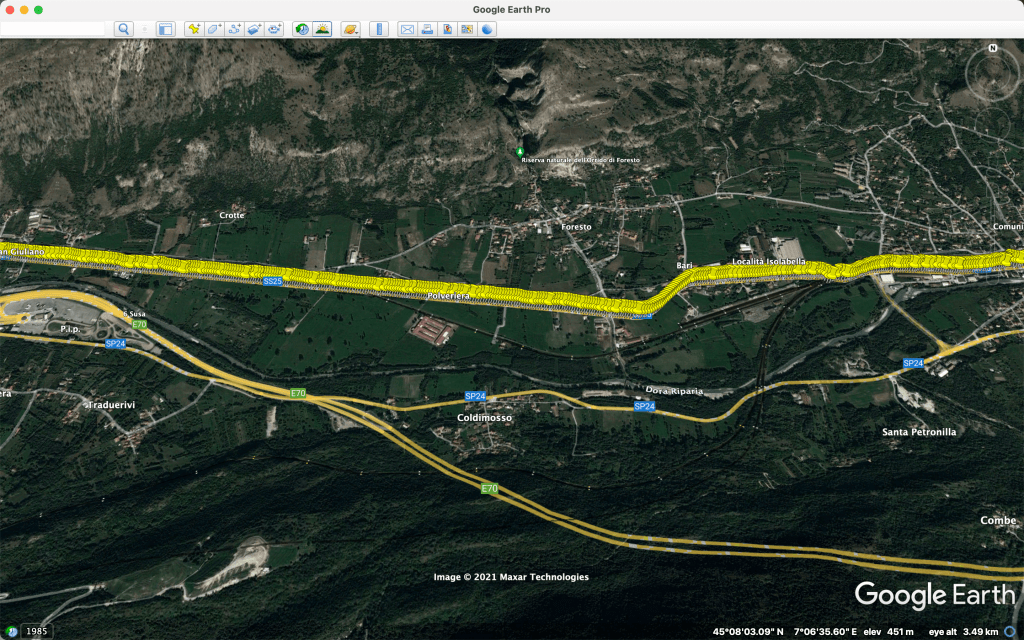
Some satellite images of Agis’ track on Day 34, between Susa and Bardonecchia:
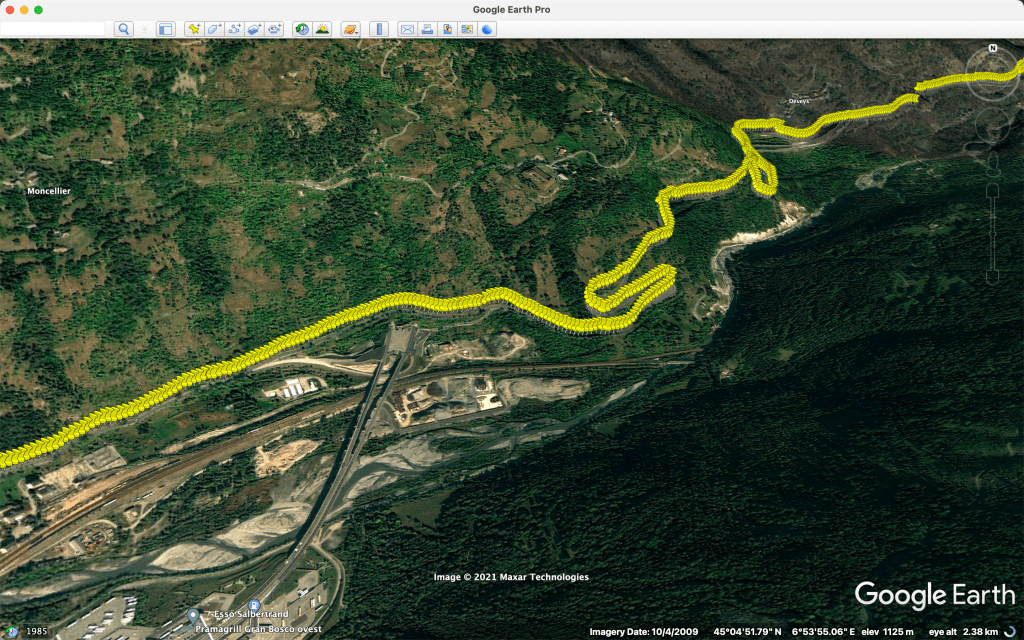
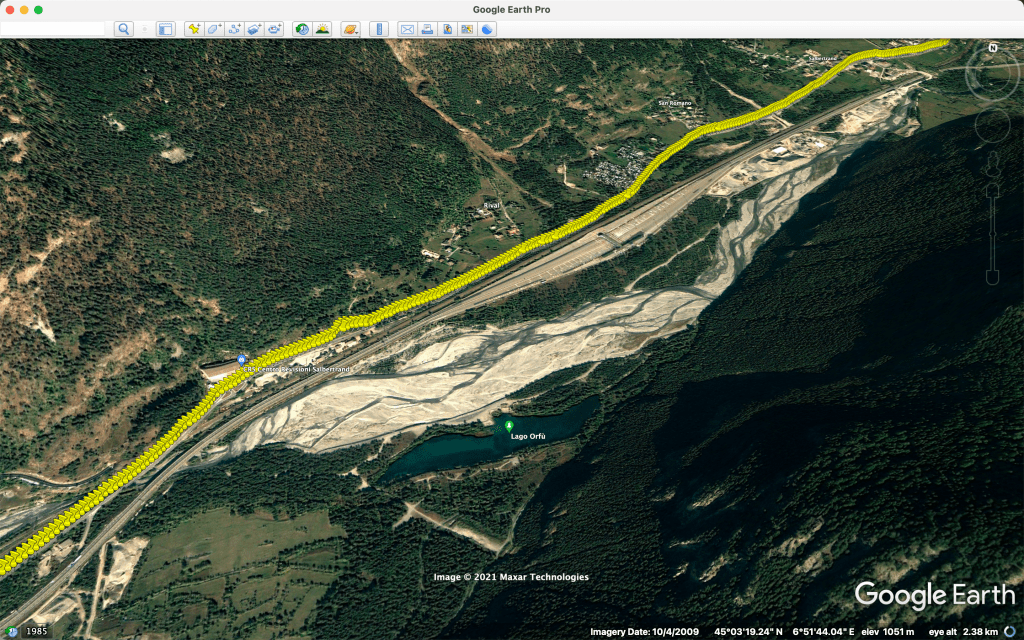

The satellite images above show Agis’ track in the upper Susa valley. Here the valley is narrower, and in parts the freeway, the train tracks and the State Road (the one were Agis was running on) are running very close to each other. Not the idillic icon you would expect in an Alpine landscape… The heavy traffic takes its toll on the valley, as we can also see from Agis’ AQ Monitor data. NO2 is especially high, something that you would never expect in a forested Alpine valley.
Day 34 Air Quality stats:
| | Low Pollution | High Pollution | Average Pollution | Total |
| PM2,5 (μg/m3) | 1 | 116,2 | 18,1 | |
| NO2 (μg/m3) | 5,6 | 137,2 | 67,3 | |
| KM run | 9 | 27,5 | | 36,5 |
| Running time | 01:28 | 04:28 | | 05:56 |
STATS totals for Agis’ run on Italian soil:
| Day in Italy | Day since start in Athens | Date (2021) | Tract | Average PM2,5 | Average NO2 | KM low Pollution | KM high Pollution | Time low Pollu- tion | Time high Pollu-tion | Tot KM | Tot Time |
| 1 | 9 | 19/08 | Venezia – Padova | 59,2 | 30,6 | 7,5 | 36 | 00:50 | 04:49 | 43,5 | 05:39 |
| 2 | 10 | 20/08 | Padova – Vicenza | 46,6 | 53,1 | 15 | 18,6 | 01:50 | 02:33 | 33,6 | 04:23 |
| 3 | 11 | 21/08 | Vicenza – Verona | 52,7 | 82,7 | 14 | 39 | 02:05 | 05:43 | 53 | 07:48 |
| 4 | 12 | 22/08 | Verona – Brescia | 67 | 224,8 | 2,6* | 13,4* | 00:22* | 01:49* | 69,2 | 11:30 |
| 5 | 15 | 25/08 | Brescia – Bergamo | ND | ND | ND | ND | ND | ND | 56 | 08:04 |
| 6 | 19 | 29/08 | Bergamo – Milano | 27,8 | 13,9 | 31 | 18,4 | 07:03 | 03:35 | 49,4 | 10:38 |
| 7 | 20 | 30/08 | Milano – Arluno | 9,7 | 16,3 | 23 | 3 | 04:07 | 00:20 | 26 | 04:27 |
| 8 | 25 | 04/09 | Arluno – Novara | 5,2 | 4,5 | 30 | 0 | 04:45 | 00:00 | 30 | 04:45 |
| 9 | 26 | 05/09 | Novara – Santhia’ | 15,7 | 31,4 | 35,7 | 10 | 05:27 | 01:40 | 45,7 | 07:07 |
| 10 | 28 | 07/09 | Torino – Crescentino | 22,7 | 39,1 | 18,2 | 26 | 02:55 | 04:11 | 44,2 | 07:06 |
| 11 | 32 | 11/09 | Santhia’ – Crescentino | 34,3 | 32,5 | 12 | 12,3 | 01:59 | 02:10 | 24,3 | 04:09 |
| 12 | 33 | 12/09 | Torino – Susa | 11,4 | 48,9 | 24,2 | 31 | 03:18 | 04:41 | 55,2 | 07:59 |
| 13 | 34 | 13/09 | Susa – Bardonecchia | 18,1 | 67,3 | 9 | 27,5 | 01:28 | 04:28 | 36,5 | 05:56 |
| TOT | 30,9 | 53,8 | 222,2* | 235,2* | 36:09* | 35:59* | 566,6 | 89:31 |
The summary table above shows that:
- Agis ran in Italy for practically half the time and distance under conditions of low Air Pollution and for another half under high Air Pollution.
- The worse Air Quality was met in the Veneto and eastern Lombardia regions, while the best AQ was met in the western Lombardia and Piemonte regions.
- Overall, the Padana Plain had an average particulate PM2,5 Pollution three times higher than the safety limit set by the WHO, and a NO2 Pollution that was also above the safety limit set by the WHO.
Bottom line is that if you want to do outdoor exercise in N Italy under healthy Air conditions within the WHO guidelines (PM2,5 below 10 μg/m3), you probably have no other option than wearing a good mask to protect yourself against the high particulate levels, or exercise only during days when the wind or the rain clean out the atmosphere. The high levels of NO2 are also worrying because this gas is known to cause asthma and other respiratory problems.

2 thoughts on “Daily Air Quality measurements along Agis Emmanouil’s 2421km Athens-Glasgow Climate Run. Part 2: ITALY”